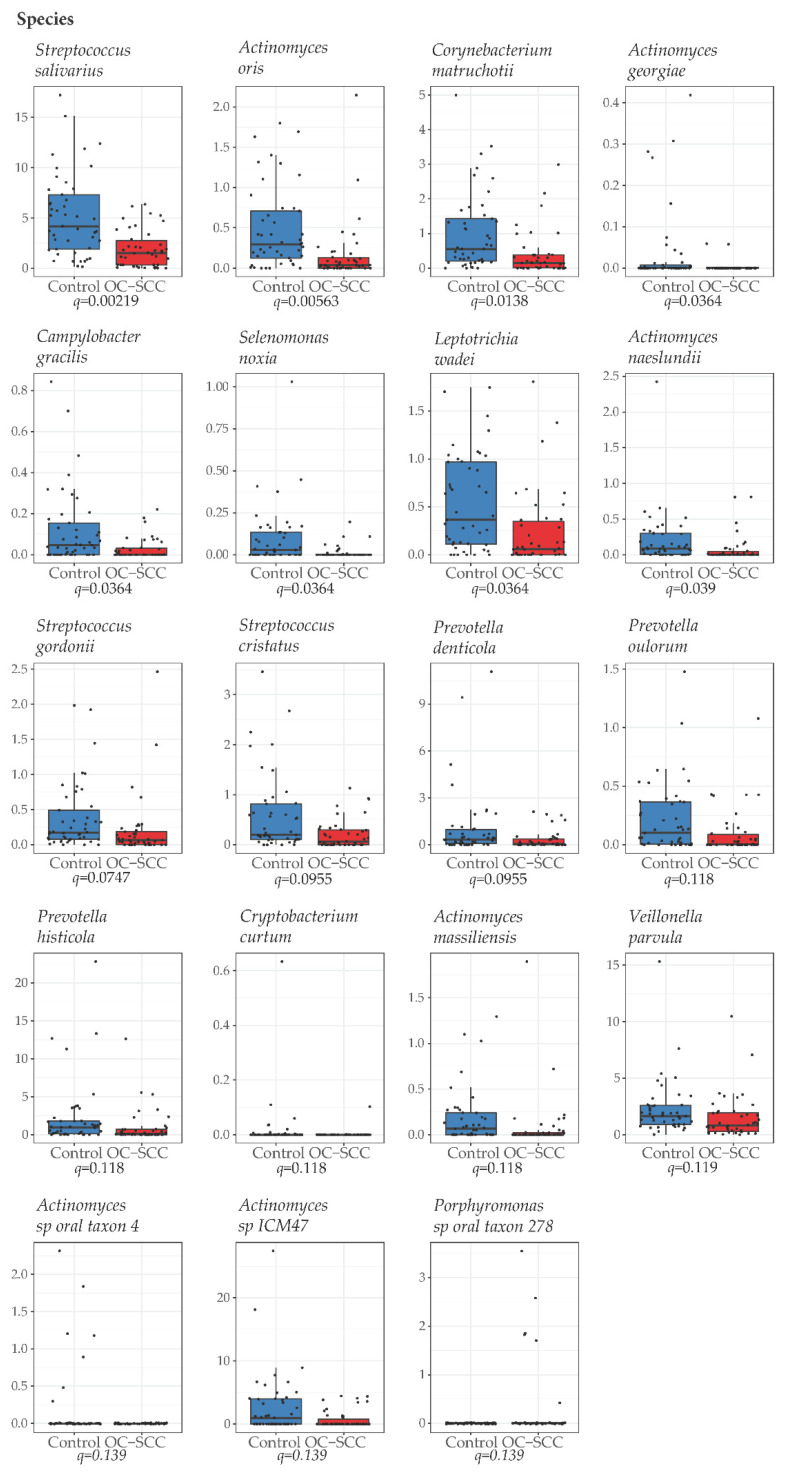
Figure 3.
Differential bacterial species between nonsmoking OC-SCC patients and non-OC-SCC control patients. The Y-axis shows relative abundance in percentage. The difference in the relative abundance of species was evaluated by the Mann–Whitney test and a false discovery rate–adjusted p value (q value) <0.20 was used as the threshold for significance.

