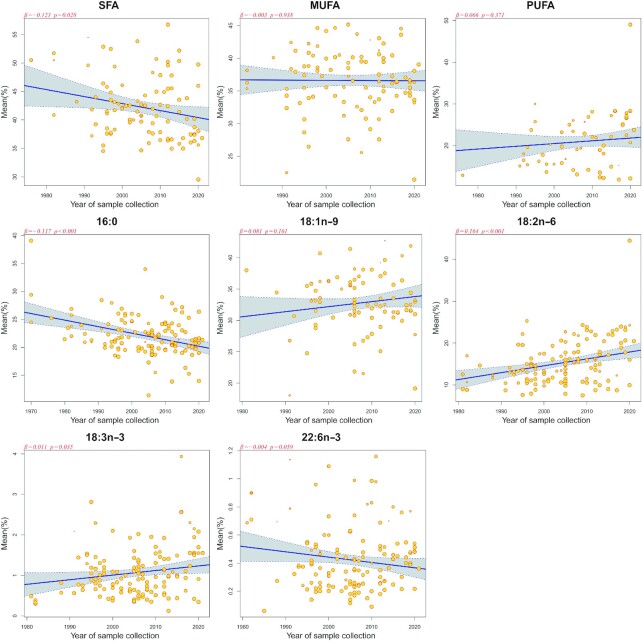
FIGURE 7.
The meta-regression analysis on the relation between selected fatty acids concentration in human milk and year of sample collection. β and P values were derived from meta-regression analysis after adjustment for sample size, study regions, and lactation stages. Each circle represents a study, and the size of the circle represents the weight of the study.

