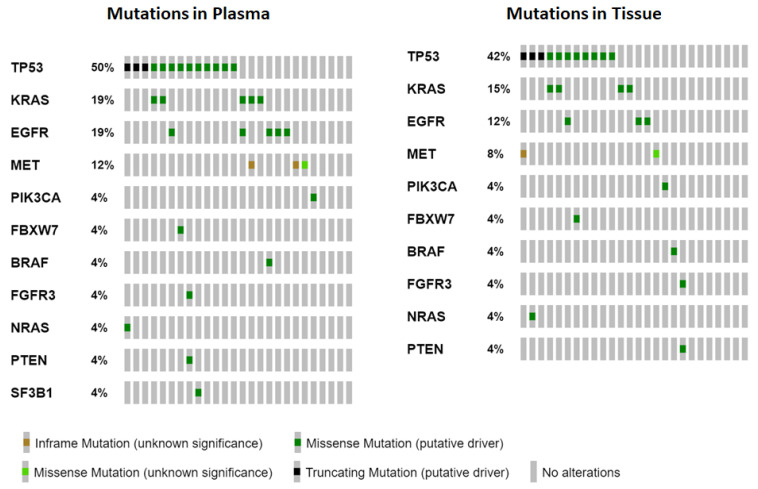
Figure 1.
OncoPrint comparative illustrations showing frequencies and types of alterations for the identified genes (rows, sorted by percent alterations) in the study patients (columns) for both plasma samples (left) and tissue samples (right) (https://www.cbioportal.org/oncoprinter (accessed on 5 November 2022)).

