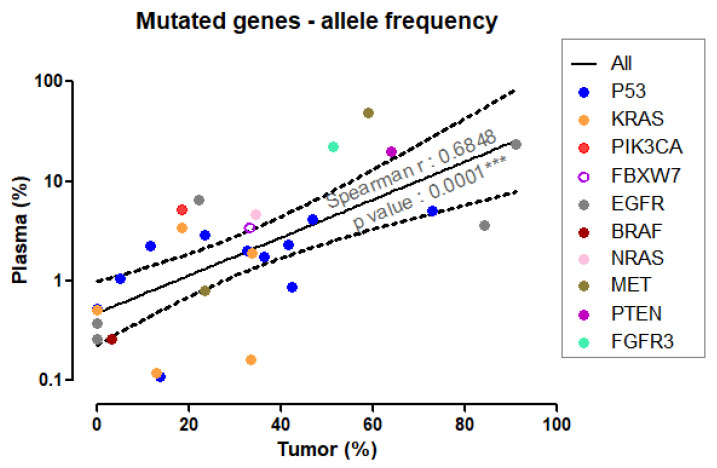
Figure 3.
Correlation between plasma and tumor allele frequency. As plasma allele frequency followed a log-normal distribution, these data were log10-normalized, while the tumor values, passing the Kolmogorov–Smirnov normality check, were used as a percentage. The solid line represents the linear regression best fit, dashed lines show the 95% confidence interval. The slope deviated significantly from zero, with a p-value < 0.0001.

