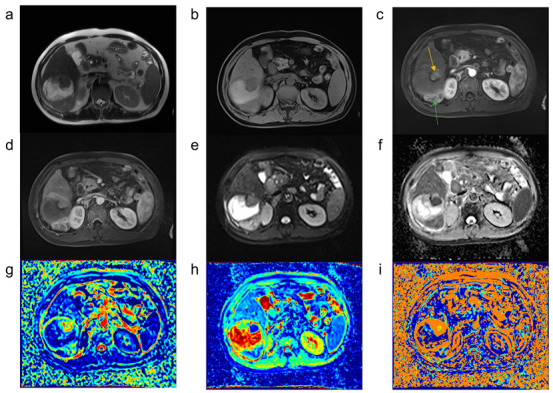
Figure 4.

Magnetic resonance images of hepatocellular carcinoma treated using TACE. Most of the tumors after TACE treatment were necrotic, with the tumor active area (orange and green arrows) visible on the edge, which was significantly enhanced at the arterial phase, and the DWI image also showed a high signal intensity. (a) T2-weighted image; (b) T1-weighted image; (c,d) MR enhanced images; (e) diffusion-weighted image with a b value of 0 s/mm2; (f) ADC image; (g–i) parametric maps (f, D, and D*, respectively) calculated from the IVIM.
