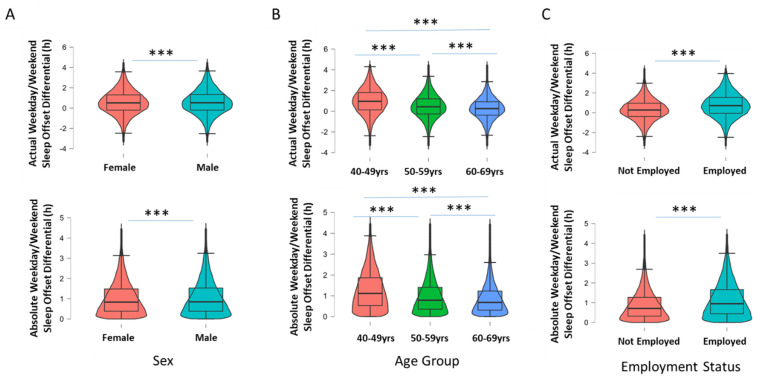
Figure 2.
Box-and-violin plots showing (A) actual and absolute WD/WE in males and females; (B) actual and absolute WD/WE according to three age groups of participants (40 to 49 years old, 50 to 59 years old and 60 to 69 years old); and (C) actual and absolute WD/WE in participants currently in employment and currently not in employment. *** denotes p < 0.001 for pairwise comparisons (Tukey post hoc test following p < 0.001 for one-way ANOVA for age groups).

