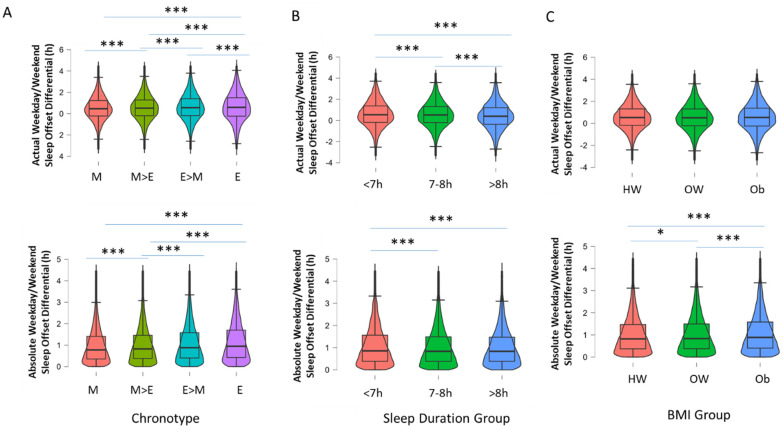
Figure 4.
Box-and-violin plots showing (A) actual and absolute WD/WE according to chronotype grouping (M = morning, M > E = more morning than evening, E > M = more evening than morning and E = evening); (B) actual and absolute WD/WE according to three groups based on self-reported typical sleep duration (<7 h a night, 7–8 h a night, >8 h a night); and (C) actual and absolute WD/WE in groups based on BMI (HW = healthy weight, BMI > 19.99 < 24.99, OW = overweight, BMI > 24.99 < 29.99, OB = obesity, BMI > 29.99). *** denotes p < 0.001, * p < 0.05 for pairwise comparisons (Tukey post hoc test following p < 0.001 for one-way ANOVA).

