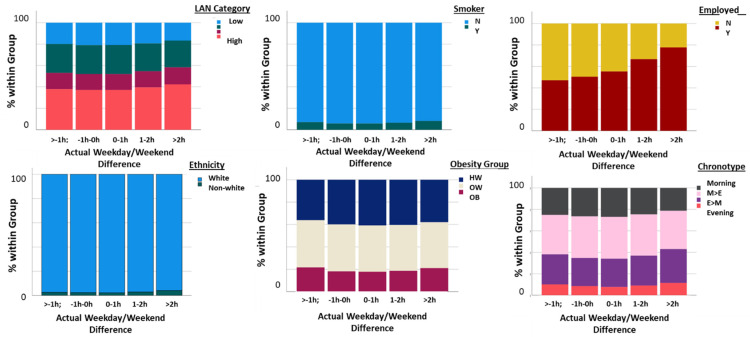
Figure 6.
Bar graphs showing the associations between actual WD/WE sleep offset differences, expressed as a categorical variable with five levels (>−1 h, −1 h to 0 h, 0 h to 1 h, 1 h to 2 h, >2 h) with LAN categories (expressed as quartiles, low to high), smoking status (note the overall low level of smoking in the sample), employment status, ethnicity expressed as white/non-white (note the small percentage of non-white participants in the sample overall), obesity group (HW = healthy weight, OW = overweight, OB = obese) and chronotype as categorized as morning types, more morning than evening type (M > E), more evening than morning types (E > M) and evening types.

