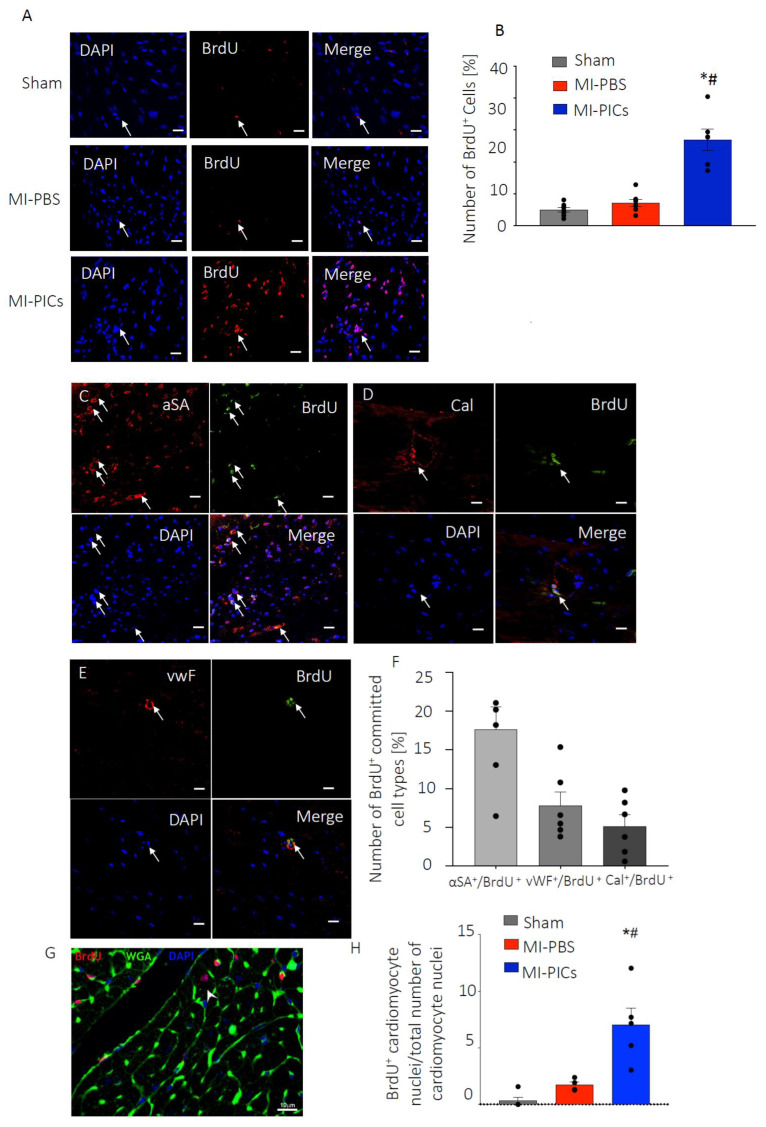
Figure 4.
PICs transplantation increases proliferation and number of BrdU+ cardiomyocytes. (A) Representative confocal micrographs in the RR of the LV of BrdU (Red) positive cells. DAPI stain nuclei blue. Scale bar = 10 µM. Arrows indicate positive staining colocalisation. (B) Quantification of the number of proliferating BrdU-positive cells in the RR in Sham = 8, MI-PBS = 7 and MI-PICs = 6 groups. Data are Mean ± SEM of the total number of BrdU+ cells over the total number of cells (DAPI), * p < 0.05 vs. sham, # p < 0.05 vs. MI-PBS. (C–E) Representative confocal micrographs in the RR of the LV of BrdU (Green) positive, α-sarcomeric actin-expressing ((C), Red), calponin-expressing ((D), Red) or vWF-expressing ((E), Red) cells. DAPI stain nuclei blue. Scale bar = 10 µM; arrows indicate positive staining colocalisation. (F) Quantification of the number of BrdU+ trilineage cardiac expressing cells. Data are Mean ± SEM. (G) Representative image of BrdU+ cardiomyocyte (WGA) in MI-PICs. DAPI stain nuclei blue. Arrows indicate cells that show colocalisation. Sham = 5, MI-PICS = 5 and MI-PBS = 5. Scale bar = 10 µM. (H) Percent number of BrdU+ cardiomyocytes in the RR. Data are Mean ± SEM. * p < 0.05 vs. sham, # p < 0.05 vs. MI-PBS.

