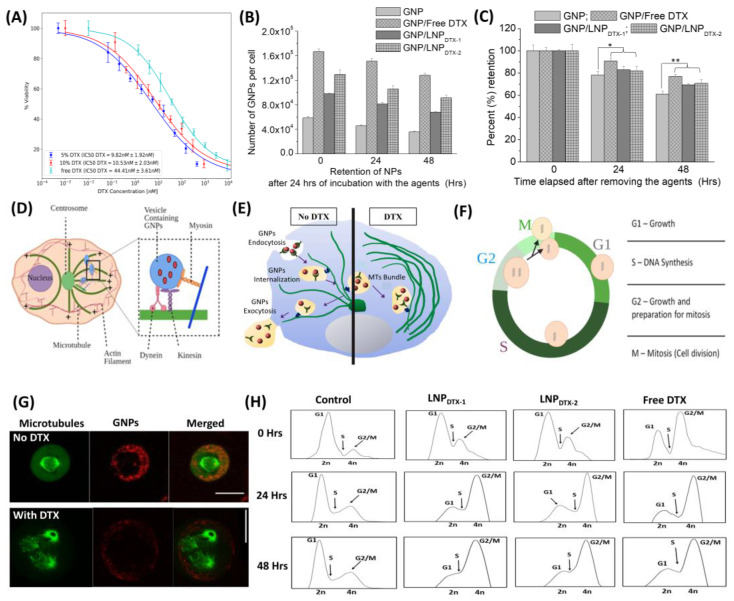
Figure 2.
Effect of free docetaxel (DTX) vs. LNPDTX-P on MIA PaCa-2 cells in vitro. (A) IC-50 curves of free DTX, 5% DTX (LNPDTX-1), and 10% DTX (LNPDTX-2). (B) Amounts of gold nanoparticles (GNPs) per cell in control cells, cells treated with free DTX, cells treated with LNPDTX-1, and cells treated with LNPDTX-2 over time. (C) GNP retention over time for control cells, cells treated with free DTX, cells treated with LNPDTX-1, and cells treated with LNPDTX-2. * indicates p < 0.05, ** indicates p < 0.01. (D) Visual illustration of GNP movement within a cell’s MTs [19]. (E) Schematic diagram illustrating the path of GNPs (red dots) within a cell in the absence and presence of DTX. (F) Cell cycle phases. In preparation for cell division, the cell goes through three different phases: a G1 gap phase between the M and S phases, an S phase where DNA replication occurs, and G2 where the cell prepares for mitosis. (G) Confocal images of dividing cancer cells: control (top) and DTX (bottom). GNPs are shown in red, and microtubules are shown in green. The scale bar: 25 µm. (H) Cell cycle assay for control cells, cells treated with free DTX, cells treated with LNPDTX-1, and cells treated with LNPDTX-2 over time.

