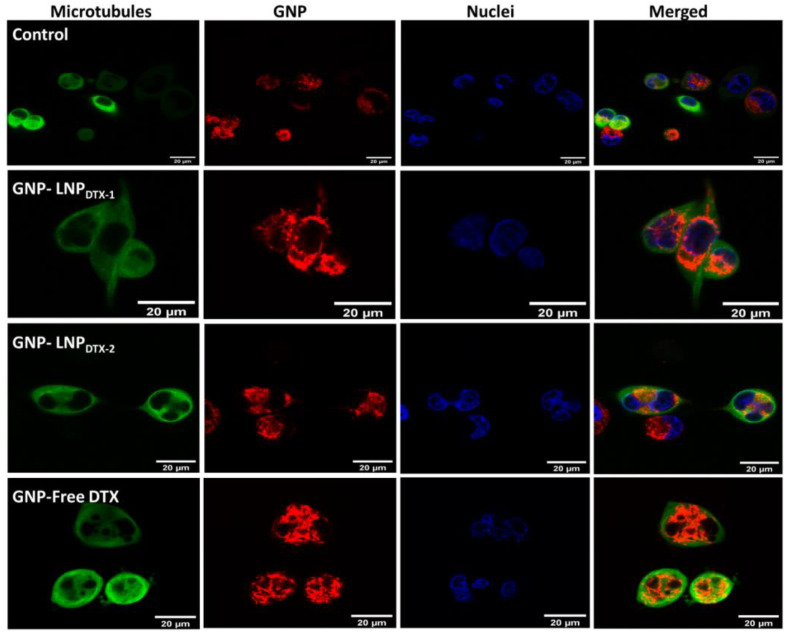
Figure 3.
Visualization of intracellular GNP distribution in MIA PaCa-2 cells using confocal imaging. Control untreated cells (1st row), cells treated with LNPDTX-1 (2nd row), cells treated with LNPDTX-2 (3rd row), and cells treated with free DTX (4th row). Microtubules in green (1st column), GNPs in red (2nd column), nuclei in blue (3rd column), and all three merged (4th column). Scale bar: 20 µm.

