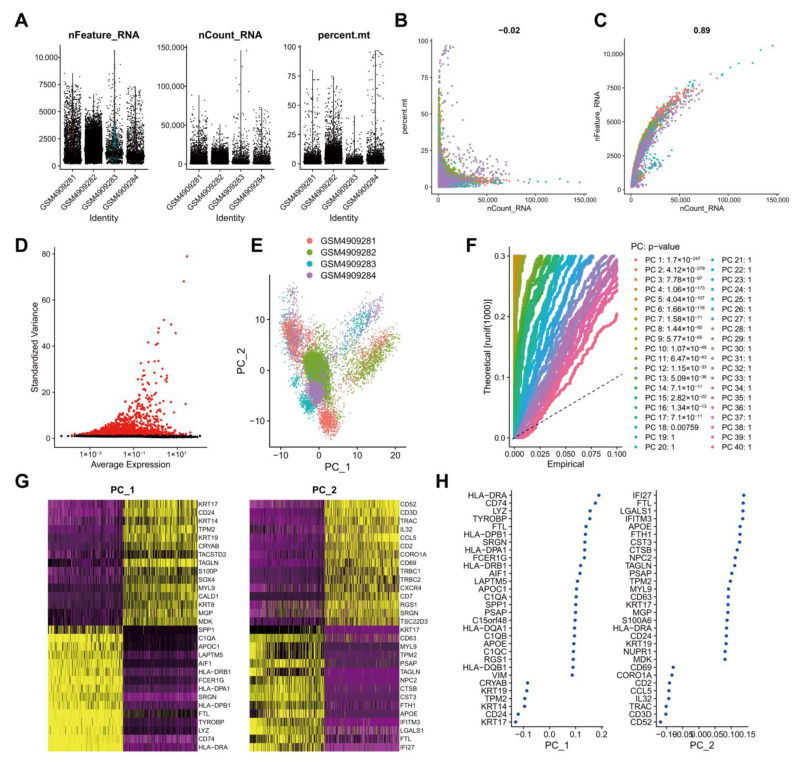
Figure 2.
Analysis of the scRNA-seq data from human TNBC tissue samples. (A): Expression of scRNA-seq data. Each dot represents one cell, nFeature_RNA ordinate represents the number of genes expressed in each cell, nCount_RNA ordinate represents the number of UMI in each cell, and percent.mt ordinate indicates the proportion of the UMI of the mitochondrial genes per cell to the total UMI of each cell; (B): A scatter plot of the relationship between the UMI and the total number of genes; (C): Highly variable genes in tumor tissue samples following variance analysis. Red dots represent highly variable genes, and black dots represent invariable genes; (D): PCA of cell cluster; (E): p values of each principal component compared using the JackStrawPlot function. Above the dotted line indicates a p value less than 0.05; (F): Principal components used for the subsequent analysis determined by the ElbowPlot function (the turning point was determined according to the variance change); (G): A dot plot of the related genes in the top two principal components. The larger absolute value of the abscissa value reflects the higher correlation; (H): A heat map of the expression of related genes in the top two principal components. The darker color reflects the greater expression.

