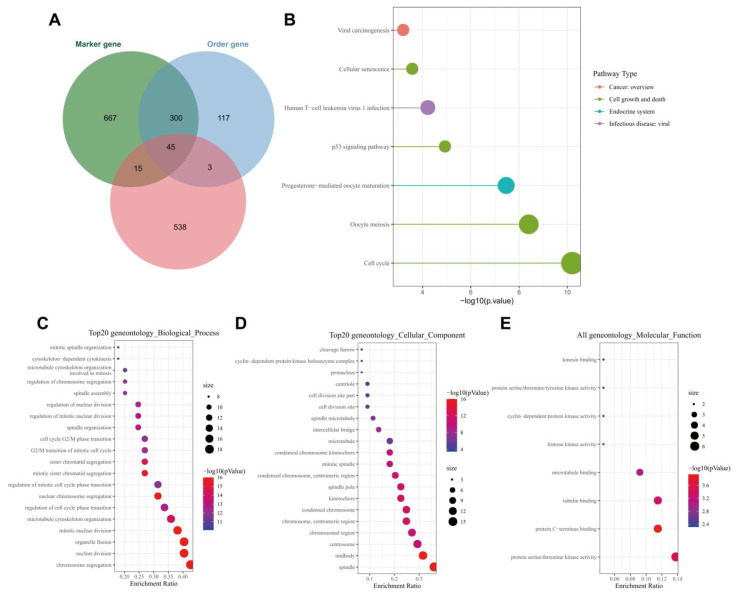
Figure 4.
Functional enrichment analysis of the key genes. (A): Venn diagram of tumor stem cell-related marker genes, order gene and module genes; (B): KEGG enrichment analysis of the 45 key genes. The color indicates the pathway categories and the circle size represents the number of targets enriched; (C): A bubble diagram of the GO-BP analysis results of the 45 key genes; (D): A bubble diagram of the GO-CC analysis results of the 45 key genes; (E): A bubble diagram of GO-MF analysis results of the 45 key genes. In panels (C–E), the circle color indicates the p value, the circle size represents the number of targets enriched, and the abscissa represents the proportion of enriched targets and the ordinate indicates the pathway.

