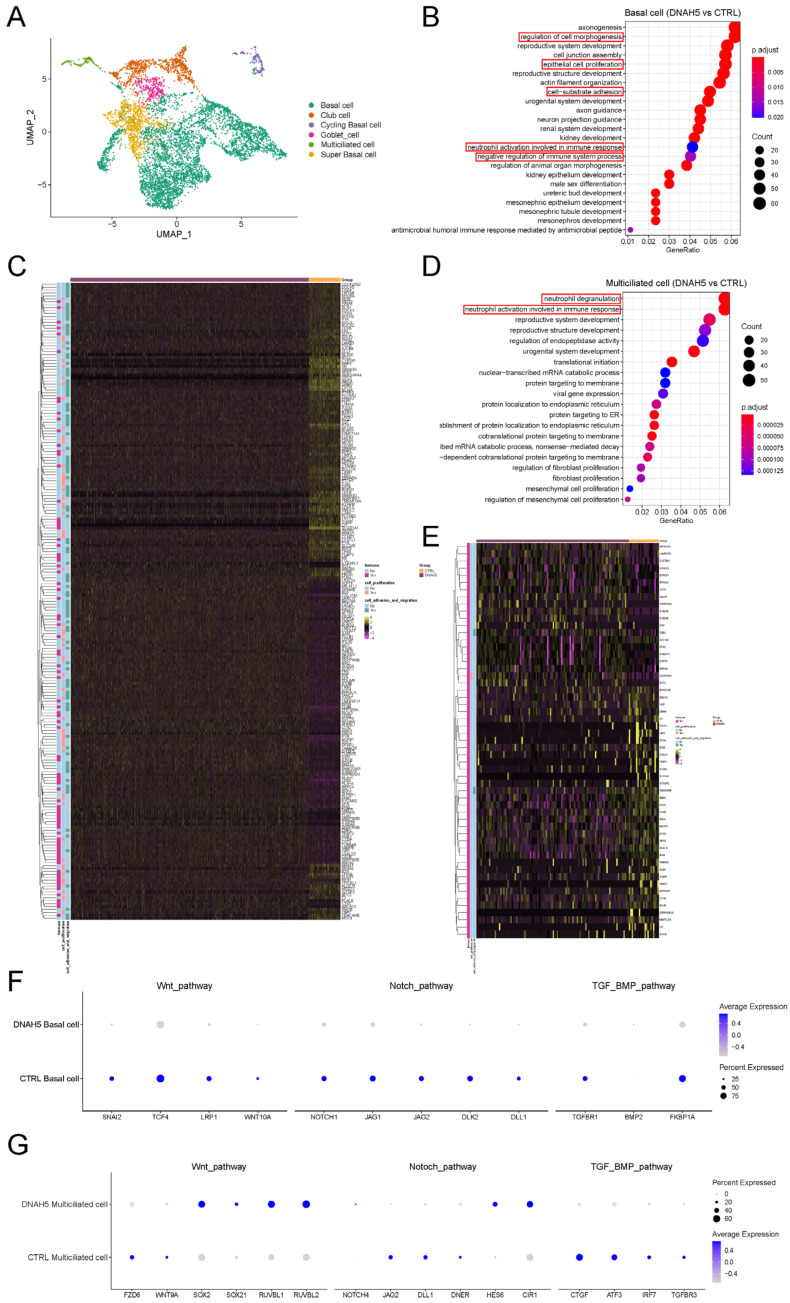
Figure 3.
Single-cell transcriptional profiles from child PCD organoids. (A) UMAP plots of expression from scRNA-Seq of child airway organoids (DNAH5-mutated and control). (B) GO enrichment analysis of biological processes in basal cells (DNAH5 vs. CTRL). (C) Heatmap of the differentially expressed genes in immune response, regulation of cell morphogenesis, cell-substrate adhesion and epithelial cell proliferation between DNAH5 mutation and normal organoids. (D) GO enrichment analysis of biological processes in multiciliated cells (DNAH5 vs. CTRL). (E) Heatmap of the differentially expressed genes in the immune response between DNAH5-mutated and normal organoids. (F,G) Dot plot of Wnt, TGF-β/BMP and Notch pathway-regulated genes in basal cells and multiciliated cells in DNAH5-mutated and normal airway organoids. The colour gradient (grey to blue) and dot size indicate the mean marker expression and the percentage of cells expressing the marker for each cluster.

