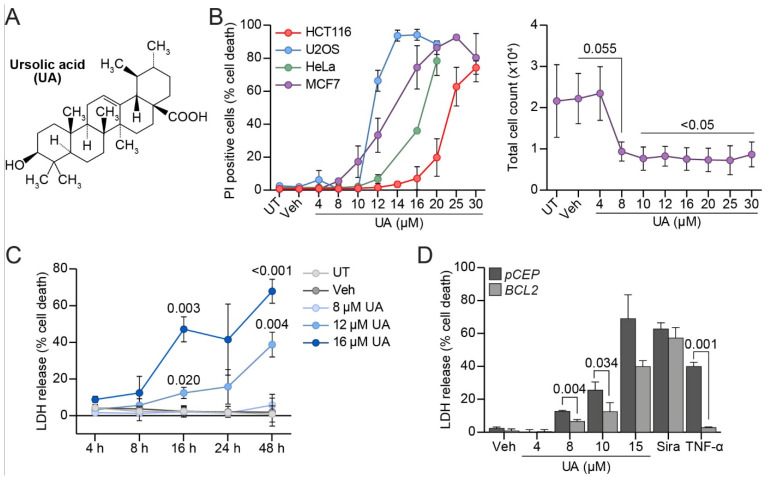
Figure 1.
UA halts proliferation and induces cell death partly through apoptosis. (A) Structure of UA. (B) Cell death (%) in MCF7, HeLa, U2OS, and HCT116 cells after 24 h treatment with indicated concentrations of UA (left). Cell death measured by propidium iodide (PI) uptake assay. Total cell counts of MCF7 cells 48 h after treatment with the indicated concentrations of UA (right). (C) Cell death (%) in MCF7 cells after UA treatment. Duration and concentration of treatment indicated on figure. Cell death measured by lactate dehydrogenase (LDH) release assay. (D) MCF7-pCEP and MCF7-BCL2 cells treated for 48 h with indicated concentrations of UA, 10 μM siramesine, or 200 ng/mL TNF-α. Cell death measured as in (C). Data is shown for a representative experiment. See Suppl. Figure S1 for all the independently performed experiments. The p-values were defined by a multiple unpaired t-test with a Welch’s correction comparing each treatment to the vehicle in (A) (see Supplementary Figure S1B for p-values), (B) (right) and (C). A similar test was performed on the triplicates of one experiment comparing the cell death in MCF7-BCL2 to MCF7-pCEP for each treatment in (D). Abbreviations: (UT) untreated, (Veh) vehicle.

