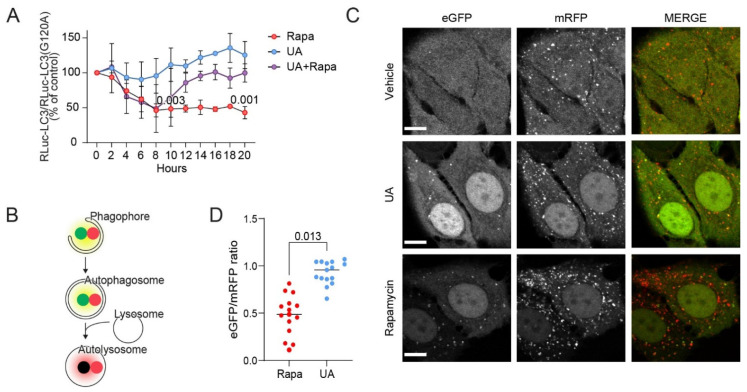
Figure 2.
UA inhibits autophagy at the maturation step. (A) Autophagic flux assessed by comparing luciferase activity ratios in MCF7-RLuc-LC3 and MCF7-RLuc-LC3(G120A) cells treated with 20 nM of rapamycin (rapa), 8 μM UA or both for the indicated time points. The values were normalized to time 0 (set at 100%). Rapamycin served as the positive control for the autophagy induction [52]. n = 2 for all data points except for 10 h and 20 h where n = 4. (B) Illustration of the tfLC3 assay: immature neutral vesicles will express a yellow signal from the eGFP and mRFP coupled to LC3 whereas mature acidic autophagosomes will appear red. (C) Representative confocal images of MCF7-tfLC3 cells treated for 24 h with the vehicle (DMSO), 8 μM of UA, or 100 nM of rapamycin. Bars: 10 μm. (D) Ratio of eGFP and mRFP signal from the MCF7-tfLC3 cells treated for 24 h with 8 μM of UA or 100 nM of rapamycin. The eGFP/mRFP ratio was quantified for each LC3 punctum. A total of 5 cells were analyzed for each experiment and the mean for each of the 15 cells are shown as data points. The p-values were defined by one sample t-test comparing each treatment at 10 and 20 h, respectively, to the baseline 100% in (A) and an unpaired t-test with a Welch’s correction performed on the mean values from the three replicate experiments in (D). No statistics were performed on the remaining time points in (A) as n = 2 for these. Abbreviations: same abbreviations as in Figure 1.

