Figure 3.
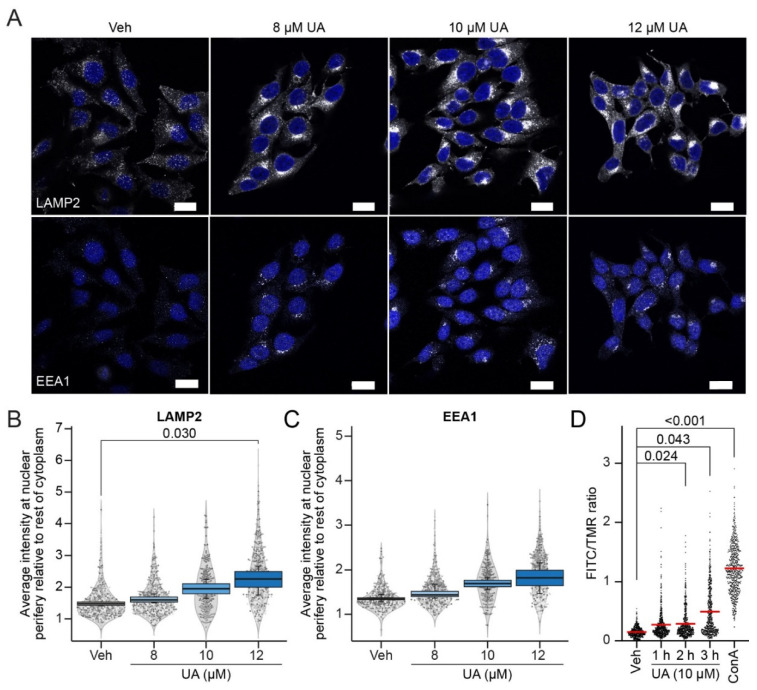
UA alters lysosomal positioning and pH. (A) Representative images of MCF7 cells treated with the vehicle (DMSO) or UA at 8 μM, 10 μM or 12 μM for 6 h, and co-stained with the markers of early endosomes (EEA1) and lysosomes (LAMP2). Nuclei were labeled with Hoechst 33342 (blue). Bars: 20 μm. (B) SuperPlot of the quantification of the LAMP2 distribution. LAMP2 nuclear proximity was scored as the mean intensity of the LAMP2 signal in a six-pixel wide (~2 µm) ring overlapping with the nuclear periphery over the LAMP2 intensity in the rest of the cytoplasm and plotted as box plots. The scatter and violin plots show the distribution of the individual (per cell) measurements represented by a sample of 150 cells per experiment. Different grey intensities of the points represent the separate experiments. (C) Identical to (B) but for EEA1 intensities. (D) FITC/TMR ratio in MCF7 cells treated with the vehicle (DMSO) or 10 μM UA for 1 h, 2 h, or 3 h. As a positive control, the V-ATPase inhibitor, concanamycin A (ConA, 100 nM), was added for 2 h. The FITC/TMR ratio was measured for each lysosome and each value is represented as a dot. A total of 200 lysosomes per replica were analyzed (with 600 in total per treatment). The red line represents the overall mean. Outliers were identified and removed using an iterative Grubbs test on each replicate with α = 0.0001. The p-values were defined in (B–D) by a multiple unpaired t-test with a Welch’s correction on the mean values from the replicate experiments. No statistics were performed on the 10 μM of UA concentration in (B,C) as n = 2 for this concentration. Each treatment was compared to the vehicle. Abbreviations: same abbreviations as in Figure 1.

