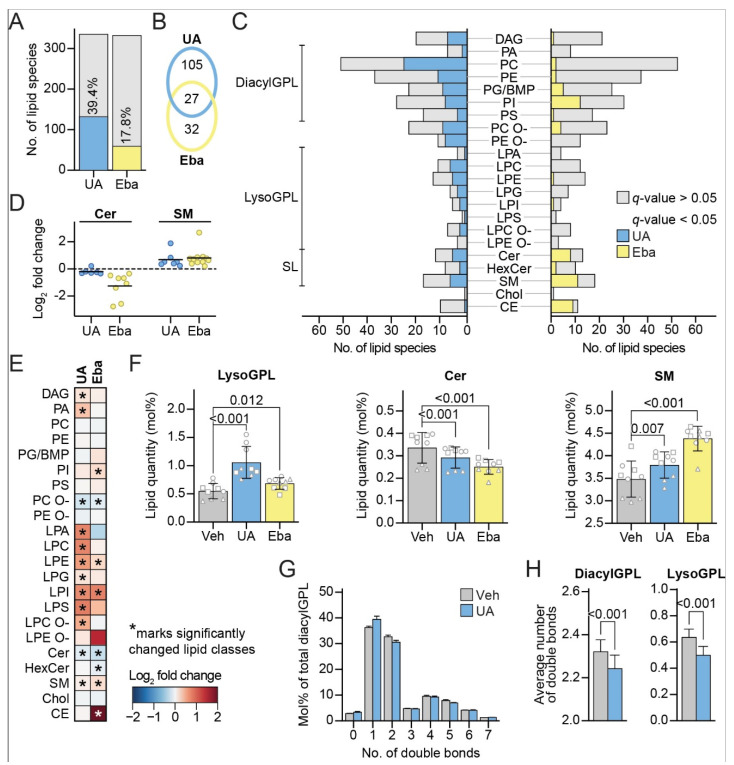
Figure 5.
UA shifts the lipid profile towards membrane instability. Lipidomics analysis of cells treated with the vehicle (DMSO) for 8 h, 8 μM of UA for 8 h or 5 μM of ebastine for 6 h. (A) Total number of lipid species included in the analysis in UA vs. the vehicle (335) and ebastine vs. the vehicle (332) comparisons (light grey). Percentage of detected lipid species that were significantly changed after treatment with either 8 μM of UA for 8 h (blue) or 5 μM of ebastine for 6 h (yellow) relative to the vehicle (DMSO)-treated cells. (B) Venn diagram showing the numbers of statistically significantly altered lipid species unique or shared between the UA and ebastine treatments. (C) Bar graph showing monitored lipid species in the indicated class (grey) and number of significantly changed lipids upon treatment vs. the control. (D) Significantly changed ceramide species shown as a log2 fold change of UA and ebastine-treated cells compared to the vehicle (DMSO) (left), and the same for sphingomyelin (right). (E) Heatmap showing log2-transformed fold changes of the different lipid classes in the UA- and ebastine-treated cells compared to the vehicle (DMSO). Classes that were significantly changed (q-value < 0.05) are marked with an asterisk. (F) Levels of lysoGPL (left), ceramide (middle) and sphingomyelin (right) given in mol% after treatment with the vehicle (DMSO), UA or ebastine. Same shaped data points represent replicates of the same experiment to illustrate day-to-day variation. (G) Distribution of lipid species in relation to double bonds given in percentage of the total diacylGPL category. (H) Average number of double bonds per single lipid in the diacylGPL (left) and lysoGPL (right) categories. Linear modelling with a Benjamini–Hochberg correction was used to determine the significantly changed lipid species in (A–D), significantly changed lipid categories and classes in (E,F) and the change in average double bond per single lipid species in (H). Linear modelling was performed on triplicates from three independent experiments (nine data points in total) accounting for the batch factor. Abbreviations: (eba) ebastine, (BMP) bis(monoacylglycero)phosphate, (GPL) glycerophospholipid, (SL) sphingolipid, (DAG) diacylglycerol, (PA) phosphatidic acid, (PC) phosphatidylcholine, (PE) phosphatidylethanolamine, (PG) phosphatidylglycerol, (PI) phosphatidylinositol, (PS) phosphatidylserine, (PC O-) acyl-alkyl PC, (PE O-) acyl-alkyl PE, (LPA) lysoPA, (LPE) lysoPE, (LPC) lysoPC, (LPG) lysoPG, (LPI) lysoPI, (LPS) lysoPS, LPC O-acyl-alkyl LPC, (LPE O-) acyl-alkyl LPE, (Cer) ceramide, (HexCer) hexosylceramide (SM) sphingomyelin, (Chol) cholesterol, and (CE) cholesteryl ester. Otherwise, abbreviations are the same as in Figure 1.

