Figure 6.
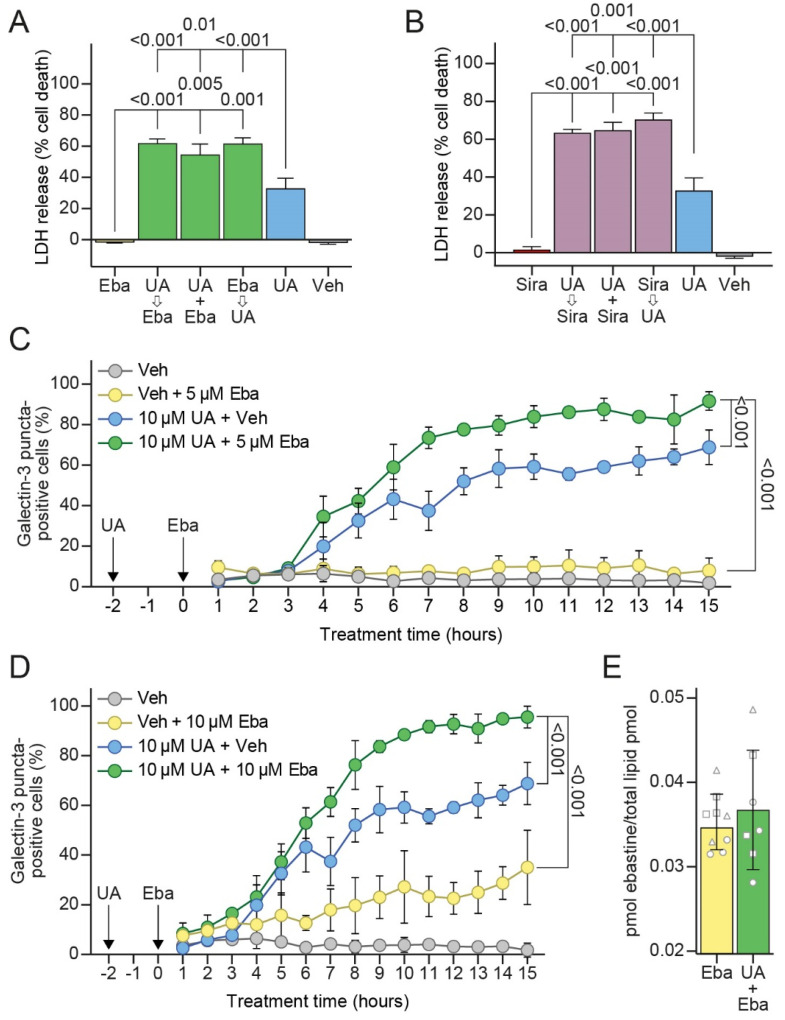
UA and CAD combination treatment enhances cell death and LMP. (A) Cell death measured in MCF7 cells pre-treated with the vehicle (DMSO), 10 μM of UA or 5 μM of ebastine 2 h prior to treating with 10 μM of UA and/or 5 μM of ebastine for an additional 48 h. Cell death measured as in Figure 1C. (B) Same as (A) but for 3 μM of siramesine. (C) Galectin-3 puncta formation in MCF7-eGFP-LGALS3 cells pre-treated with the vehicle (DMSO) or 10 μM of UA for 2 h and subsequently treated with the vehicle (DMSO) or 5 μM of ebastine for up to an additional 15 h. The percentage of cells with ≥3 galectin-3 puncta was quantified. (D) Same as (C) for ebastine 10 μM. (E) MCF7 cells pre-treated for 2 h with the vehicle (DMSO) or 8 μM of UA and subsequently treated with 5 μM of ebastine for an additional 6 h. Ebastine levels were measured using mass spectrometry and normalized to the total lipid content. Same shaped data points represent replicates of the same experiment to illustrate day-to-day variation. The p-values were defined by a multiple unpaired t-test with a Welch’s correction comparing each combination treatment to each single treatment in (A,B), an unpaired t-test of the area under the curve (AUC) values with a Welch’s correction comparing the combination treatment to each single treatment in (C,D), and an unpaired t-test with a Welch’s correction in (E). Abbreviations: same abbreviations as in Figure 1 and Figure 5.

