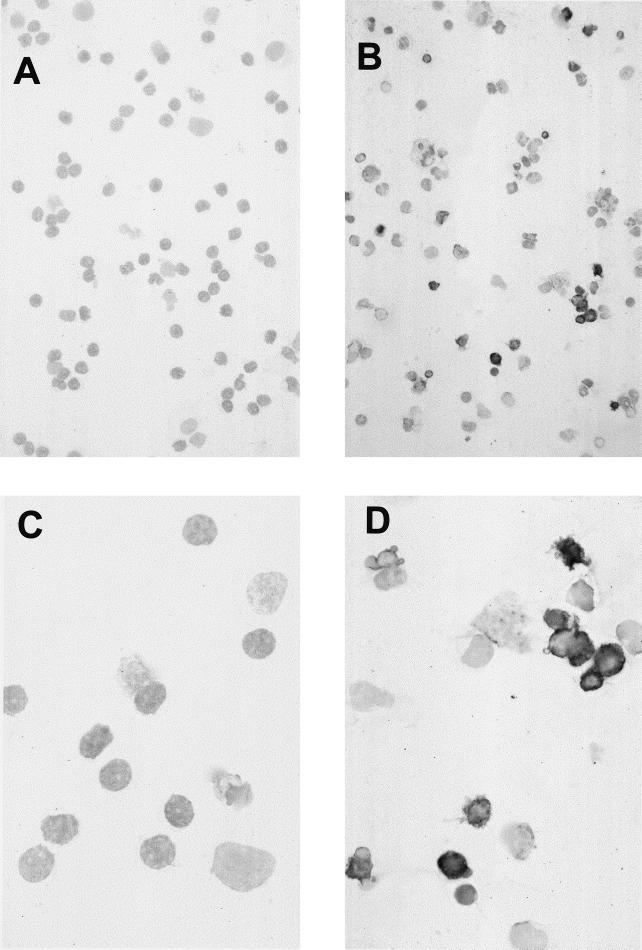
FIG. 2.
Detection of apoptotic cells by TUNEL assay: light microscopy analysis of PHA-preactivated T cells cocultivated with C. trachomatis-infected macrophages (MOI = 5). TUNEL staining was performed after 6 days of coculture. (A and C) Specificity controls; assays were performed without the addition of TdT; (B and D) TdT was added. Apoptotic nuclei appeared only after the addition of the enzyme. In the figure, apoptotic cells can be distinguished by their black staining. Cytoplasm was visualized by staining with haemalaun. The mean percentage ± standard deviation of apoptotic cells in these assays after coculture with C. trachomatis-infected macrophages (MOI = 5) was 56% ± 11% (n = 3 experiments); the frequency of apoptotic cells after coculture with noninfected macrophages was 28% ± 7% (n = 3 experiments; P = 0.001). Magnifications, ×30 (A and B) and ×75 (C and D).

