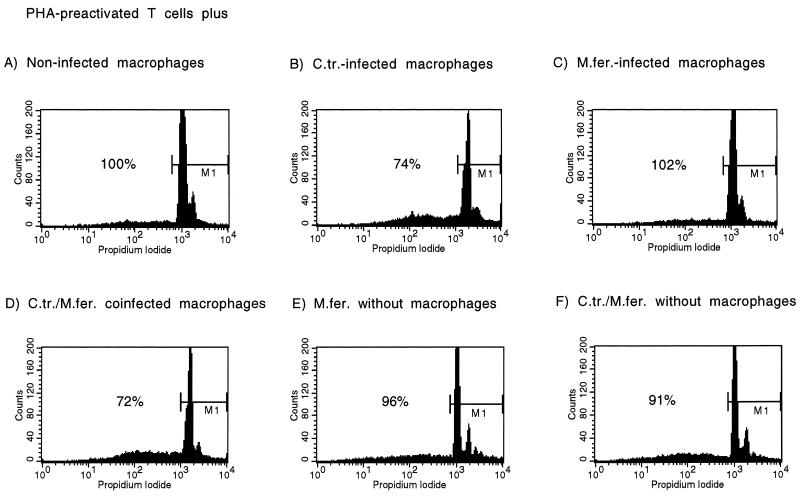
FIG. 4.
Analysis of viable cells in coculture experiments with M. fermentans-infected macrophages by flow cytometric analysis of PI-stained cells. PHA-preactivated T cells were cocultivated with macrophages. Staining was performed after 6 days of coculture. Histograms of PI-stained cells are depicted. Gated cells (marker M1) have at least a diploid DNA content. The percentages refer to the proportion of viable cells in comparison to that of the cultures of T cells with noninfected macrophages of this characteristic experiment. A total of four experiments were performed. P values refer to the different culture conditions in comparison to cultures with noninfected macrophages as determined by one-way ANOVA accounting for multiple comparisons by using the Bonferroni test. T cells were cocultivated with noninfected macrophages (A), C. trachomatis-infected (MOI = 5) macrophages (72% ± 8%; P = 0.001) (B), M. fermentans-infected (1.5 × 10⁴ CFU/ml, MOI = 0.05) macrophages (105% ± 11%; P = 1) (C), macrophages infected with C. trachomatis (MOI = 5) and M. fermentans (1.5 × 10⁴ CFU/ml, MOI = 0.05) 76% ± 5%; P = 0.005) (D), M. fermentans (1.5 × 10⁴ CFU/ml, MOI = 0.05) and C. trachomatis EBs (MOI = 5) without macrophages (95% ± 8%; P = 1) (F).

