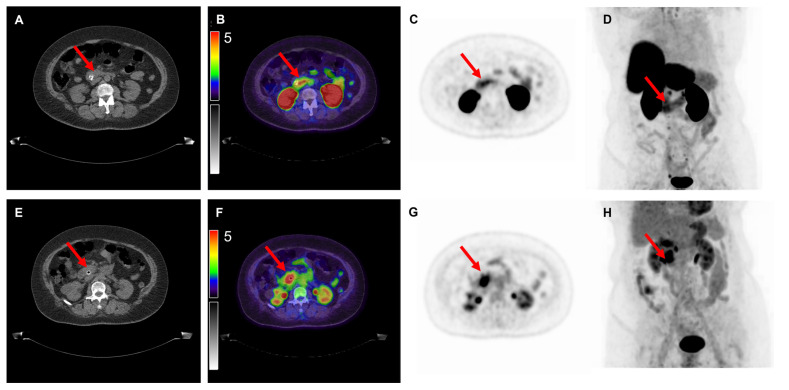
Figure 3.
Overview of imaging modalities of a patient with pT2N2M0 pancreatic ductal adenocarcinoma (patient 10). The arrows indicate (upper row) a lesion with moderate to intense [18F]DCFPyL expression with an SUVmax of 5.1 and (bottom row) a lesion with [18F]FDG uptake with an SUVmax of 10.1. From left to right: low-dose CT (A,E), fused PET/CT (B,F), PET (C,G), and the maximal intensity projection (MIP, (D,H)). Image scale SUV 0-5.

