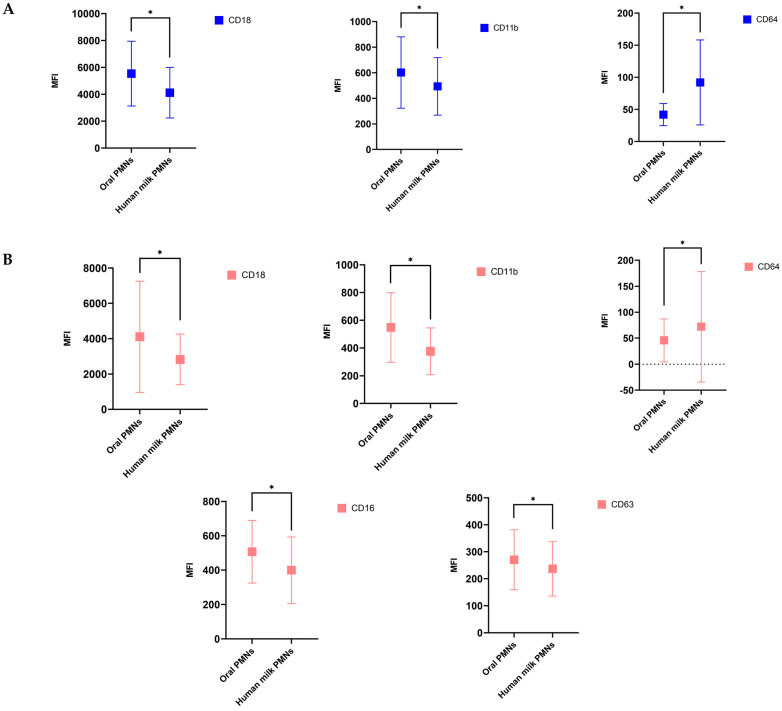
Figure 1.
Cluster of differentiation (CD) biomarkers expression levels on human milk PMNs (hmPMNs) compared to oPMNs at baseline (A) and follow-up (B). At baseline (A), hmPMNs exhibited lower expression of CD18 and CD11b biomarkers and higher expression of CD64 biomarker compared to oPMNs. In contrast, at follow-up (B), hmPMNs exhibited lower expression of CD18, CD11b, CD16, and CD63 biomarkers compared to oPMNs. CD64 biomarker expressed on the hmPMNs was also upregulated significantly compared to oPMNs at follow-up. * denotes p-value ≤ 0.05. Data are presented as Mean ± SD with p-values from paired samples t-test (for normally distributed data) and Wilcoxon Signed-Ranks test (for non-normally distributed data) to compare the activation states of oPMNs and hmPMNs.

