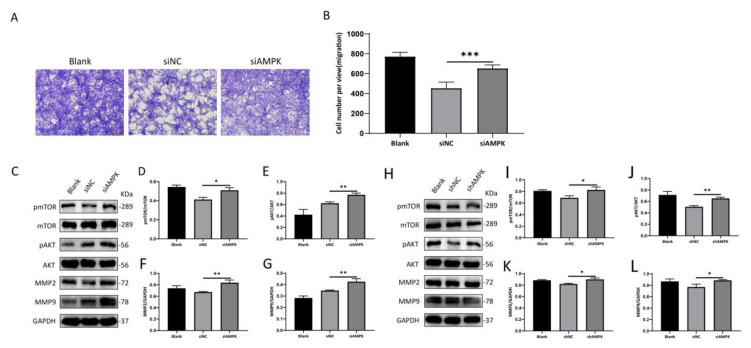
Figure 5.
Knockdown of AMPK promotes the migration of NIH 3T3 cells. NIH 3T3 cells were incubated for 24 h. (A,B) The number of migrating cells was observed in five random fields under a 100× microscope. Scale bar = 100 μm. Cell migration was quantified using ImageJ/Fiji software. Values represent the means ± SEs of the numbers of migrating cells from three independent experiments. (C–L) Relative band densities of pmTOR/mTOR, pAKT/AKT, MMP2, and MMP9 are quantified in the bar graphs. All the experiments were performed in triplicate and repeated on at least three occasions. Data are shown as means ± SDs. * p < 0.05, ** p < 0.01, and *** p < 0.001. Blank: NIH 3T3 cells, siNC: siAMPK negative control group, siAMPK: NIH 3T3 cells transfected with si−Prkaa1−mus−1337, shNC: lentivirus AMPK negative control group, shAMPK: lentivirus AMPK knockdown group 1.

