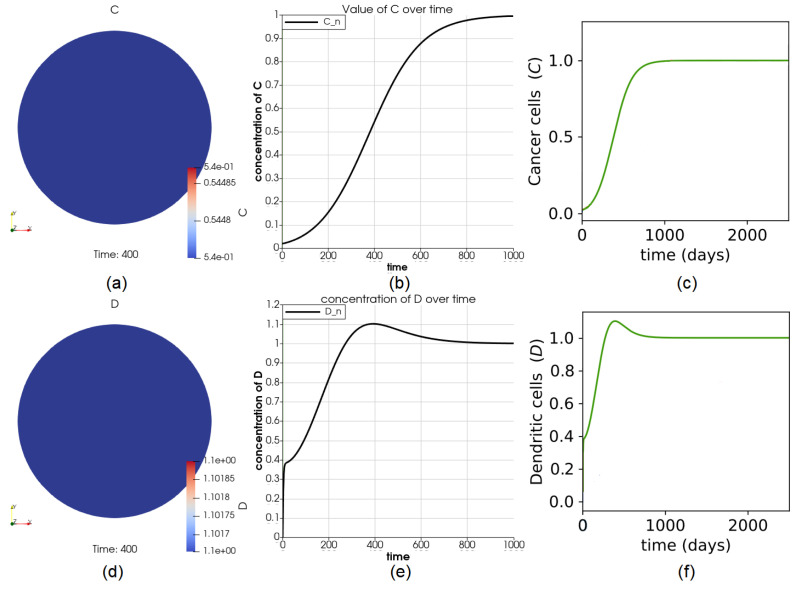
Figure 2.
Dynamics of variables C and D. Part (a) shows the value of C at time for the first group of osteosarcoma patients provided in [12]. The agreement of the curve in (b) with the green curve (results of the first group of tumors) from (c) shows that the dynamics of C at any point in the domain match the solution from the ODE paper. Sub-figure (d–f) show the dynamics of D.

