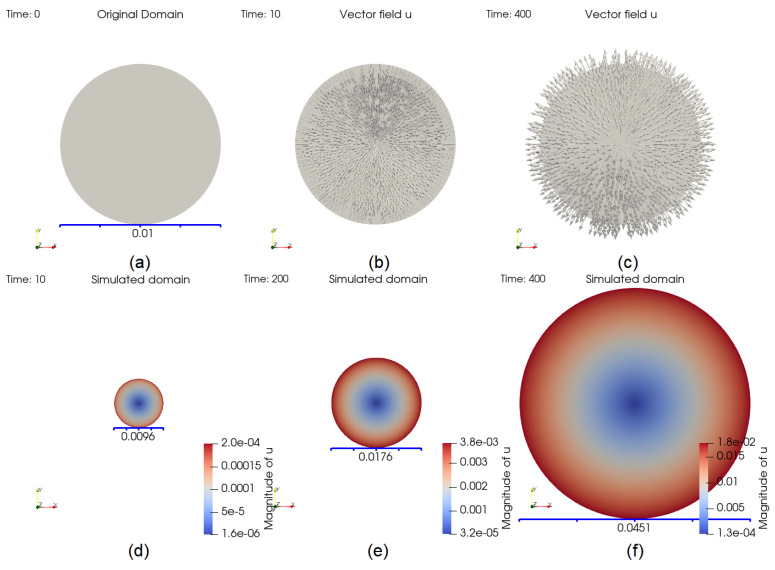
Figure 3.
Evolution of the domain. The original domain is plotted in (a). At , the arrows, showing the vector field , are pointing inward, since V is decreasing in (b) whereas in (c), they are pointing outward since V is increasing, which means that the domain is growing at . Part (d–f) show the size of the domain at time , 200, and 400, respectively.

