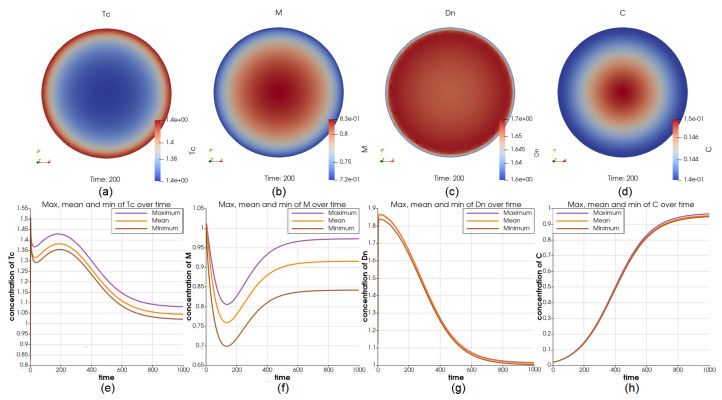
Figure 6.
Illustrations for the case of using Robin boundary condition for 5 immune cell types. Sub-figure (a–d) show the value of , M, , and C at ; Sub-figure (e–h) show the maximum and minimum in the whole interval for , M, , and C, respectively. Using the same boundary condition for 5 immune cell types results in different profiles for these cell types.

