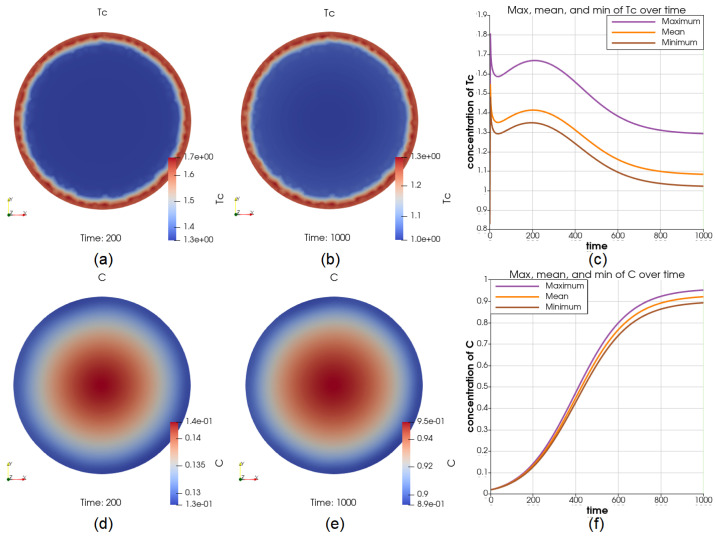
Figure 9.
Illustrations for the case of a constant source of on the boundary. Su-figures (a,b) shows the value of at and , respectively; (c) shows the dynamics of the maximum and minimum of , depicting that the value of on the boundary is constantly higher than it is elsewhere; the cancer cell concentration at and are shown in (d,e); the value of the maximum and minimum of C over the whole time interval is shown in (f), where the growth of cancer cells, especially near the boundary, are inhibited strongly by the higher concentration of .

