Figure 1.
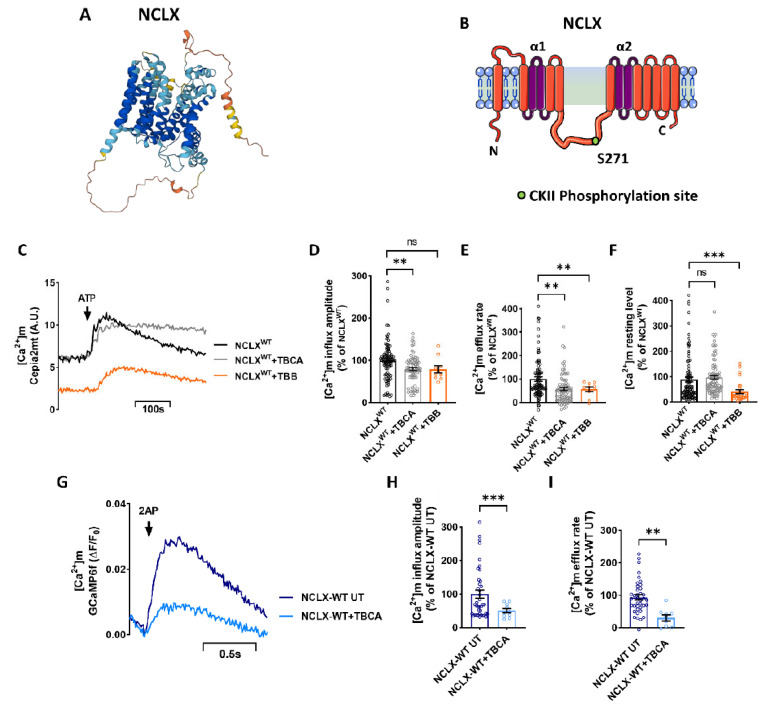
Inhibition of CKII by TBB and TBCA inhibits the [Ca2+]m transient. (A,B) Schematic model of NCLX membrane organization. (A) Was provided by AlphaFold Protein Structure Database. (B) The NCLX regulatory loop is located between the catalytic α1 and α2 domains. CKII phosphorylation site S271 is marked. (C) Representative SH-SY5Y cells co-expressing the [Ca2+]m fluorescent sensor Cepia2mt, shNCLX and NCLXWT (black), treated with TBCA (10 μM) for 2 h (grey), or TBB (10 μM) for 4 h (orange). The [Ca2+]m transient was triggered by application of extracellular ATP (100 μM) in a Ca2+-free Ringer’s solution. A.U.—arbitrary units. (D) Quantification of [Ca2+]m influx amplitudes in (C) (Welch and Brown-Forsythe ANOVA, F(2,96.56)= 6.538; Dunnett’s T3 multiple comparisons test; NCLXWT vs. NCLXWT+TBCA: **p = 0.0082; NCLXWT vs. NCLXWT+TBB: ns; n > 3). (E) Quantification of [Ca2+]m efflux rates in (C) (Welch and Brown-Forsythe ANOVA, F(2,151.4)= 11.3; Dunnett’s T3 multiple comparisons test; NCLXWT vs. NCLXWT+TBCA: **p = 0.0014; NCLXWT vs. NCLXWT+TBB; n > 3). (F) Quantification of [Ca2+]m basal intensity in (C) (Welch and Brown-Forsythe ANOVA, F (2,163.4) = 5.252; Dunnett’s T3 multiple comparisons test; NCLXWT vs. NCLXWT+TBCA: ns; NCLXWT vs. NCLXWT+TBB: ***p = 0.0009; n > 3). (G) Representative fluorescent traces action-potential (AP) induced influx of GCaMP6f expressing NCLX-WT hippocampal neurons derived from C57BL6 mice, treated (light blue) and untreated (deep blue) with TBCA (25 μM) for 2 h, stimulated at 2 Hz for 1.3 s. (H) Quantification of [Ca2+]m influx amplitude in (G) (unpaired two-tailed t-test, t = 3.580, df = 46.90, ***p = 0.0008; n > 3). (I) Quantification of [Ca2+]m efflux rates in (G) (unpaired two-tailed t-test, t = 2.21, df = 49, p = 0.0318; n > 3). n > 3. ns—not significant. Error bars denote SEM.

