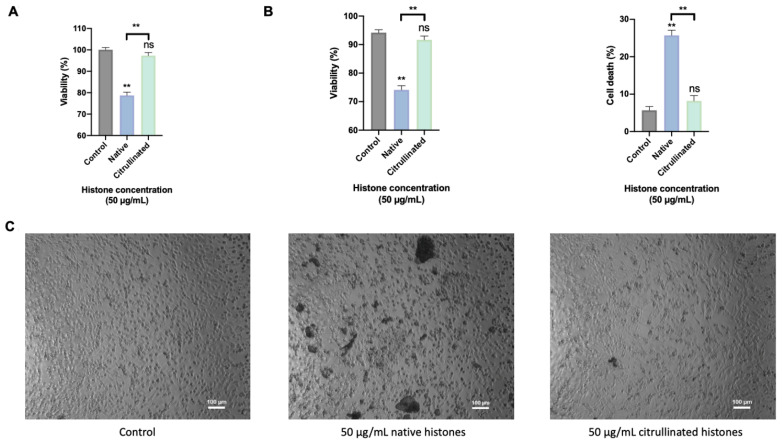
Figure 6.
Cellular viability. (A) MTT method for cellular viability measurement. (B) Flow cytometry for viability/cell death measurement. (C) Optical microscopy for showing how HUVECs respond when exposed to extracellular histones. The scale of optical microscopy images is 100 μm. Data are expressed as the mean ± SEM from 3–5 independent experiments; ** p < 0.01, ns: not statistically significant, compared to control (histones 0μg/mL) unless the lines at the top of the columns indicate differences between compared conditions. Abbreviations: ns, nonsignificant p-value.

