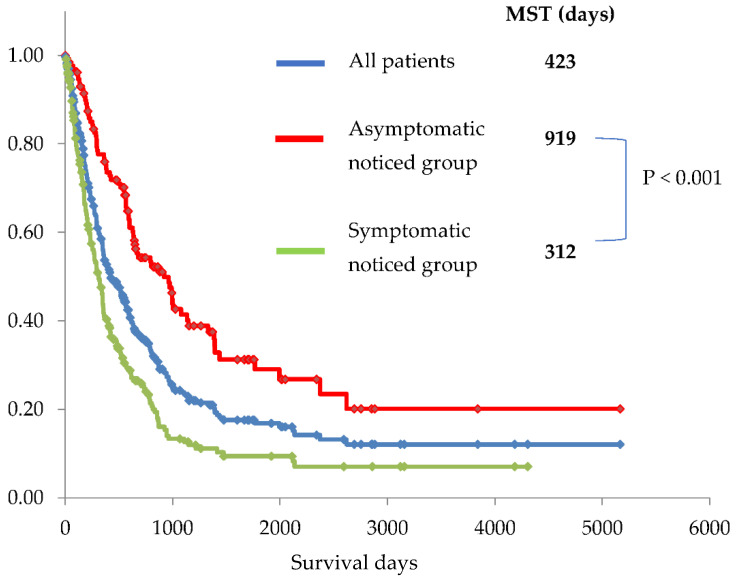
Figure 3.
Kaplan–Meier curves for all patients (blue line), symptomatic group (group 1 + 2) (green line), and asymptomatic group (group 3–8) (red line). The median survival time (MST) was significantly longer, and 5-year overall survival rate was significantly higher in the asymptomatic group than in the symptomatic group (312 days vs. 919 days and 5.4% vs. 29.0%, p < 0.001, respectively).

