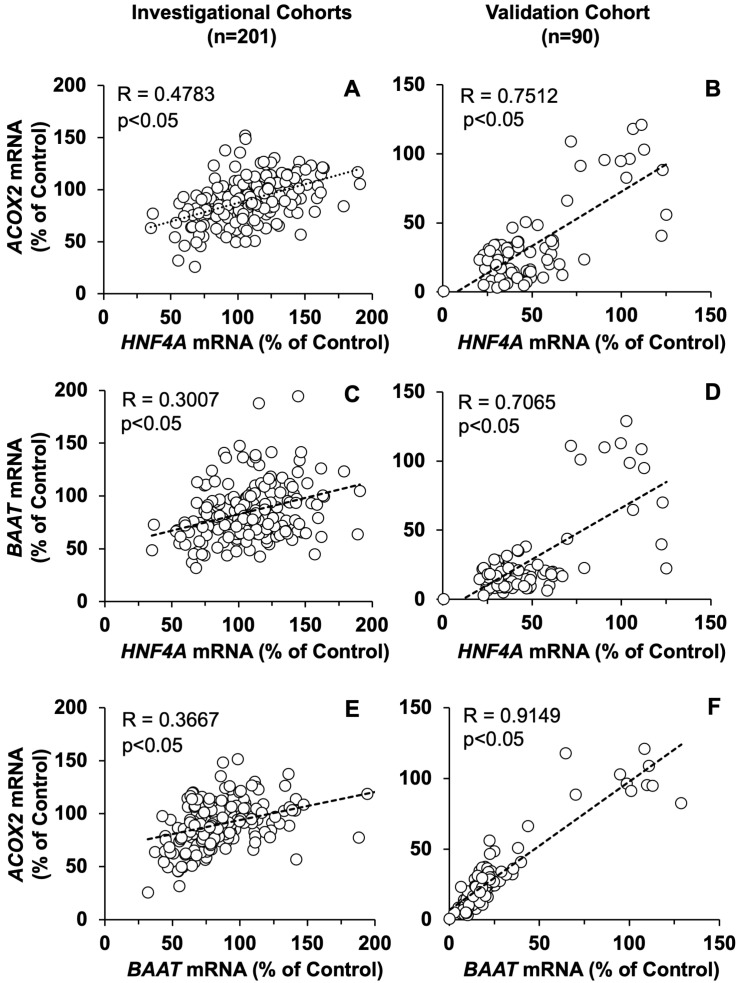
Figure 7.
Inter-relationship among the mRNA expression levels of ACOX2, BAAT, and HNF4α in the liver of patients belonging to the investigational (A,C,E) or validation (B,D,F) cohorts. To correlate values obtained from different genes in different cohorts, the percentage changes in the expression of each gene versus the average value of mRNA abundance in the control group of the same dataset were used in the plot. These data were analyzed to calculate the statistical significance of the Spearman’s rank correlation coefficient (Wessa, P. 2022, Free Statistics Software, Office for Research Development and Education, version 1.2.1, URL https://www.wessa.net; accessed on 20 May 2022).

