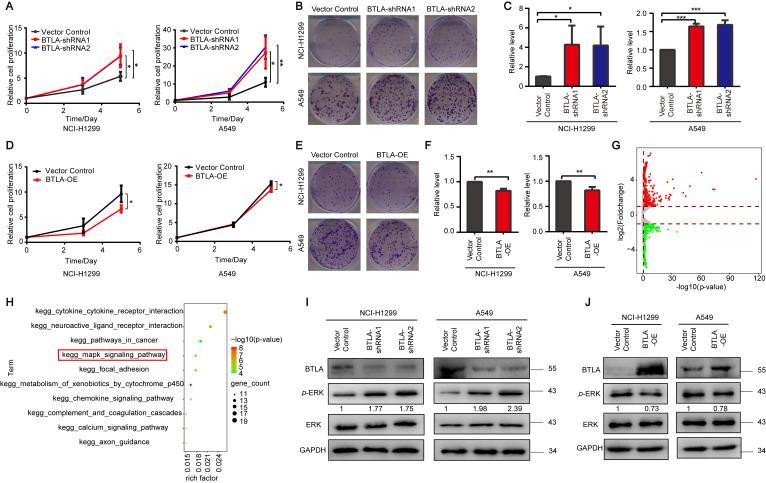
Figure 2.
Inhibition of tumor cell growth by tumor cell-intrinsic BTLA. (A,D) The Cell Titer-Glo Luminescent Cell Viability (CTG) assay for the cell proliferation of NCI-H1299 (left) and A549 (right) cells transfected with the indicated shRNAs (A) or plasmids (D) (n = 3). (B,E) Representative images of colony formation for NCI-H1299 (top) and A549 (bottom) cells transfected with the indicated shRNAs (B) or plasmids (E) (n = 3). (C,F) Quantification data of colony formation for NCI-H1299 (left) and A549 (right) transfected with the indicated shRNAs (C) or plasmids (F) (n = 3). (G) Volcano plot showing differentially expressed genes (DEGs) in BTLA KD of A549 cells. (H) The top 10 enriched KEGG pathways of BTLA KD enriched by DEGs from (G). (I,J) Immunoblot analysis of the indicated proteins in NCI-H1299 (left) and A549 (right) cells transfected with the indicated shRNAs (I) or plasmids (J). Data are presented as the mean ± SD from three independent experiments. * p < 0.05, ** < 0.01, *** < 0.001.

