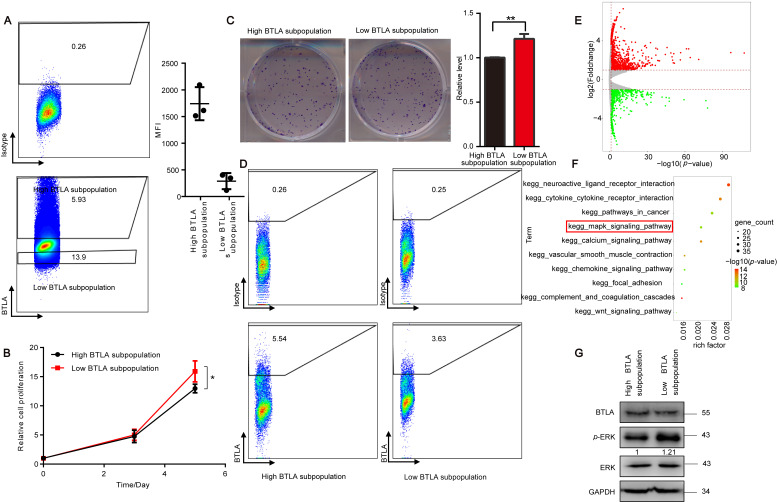
Figure 3.
Differences between the subpopulation of BTLAlow and BTLAhigh. (A) Representative images of cell sorting (left). Quantitation of BTLA protein levels in high and low BTLA subpopulations collected by cell sorting is shown as the mean fluoresce intensity (MFI) (right) (n = 3). (B) The CTG assay assessing the cell proliferation of BTLAhigh subpopulation and BTLAlow subpopulation cells (n = 3). (C) Representative images of colony formation (left) and quantification data (right) for high and low BTLA subpopulation cells (n = 3). (D) Representative flow cytometry plots of high and low subpopulations cells cultured for 10 days after cell sorting. (E) Volcano plot showing DEGs in two subpopulations collected by the cell sorting of A549 cells. (F) The top 10 enriched KEGG pathways of two subpopulations enriched by DEGs from (E). (G) Immunoblot analysis of high and low BTLA subpopulation cells. Data are presented as the mean ± SD from three independent experiments. * p < 0.05, ** < 0.01.

