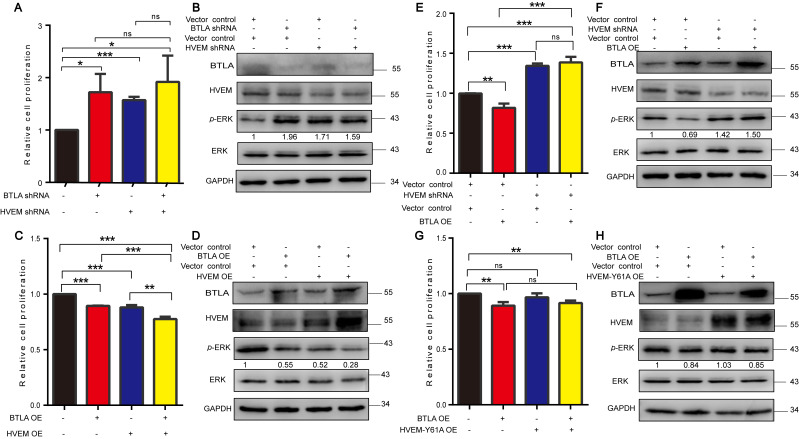
Figure 5.
The effects of BTLA depend on HVEM. Relative cell proliferation (A,C,E,G) (n = 3) and immunoblot analysis (B,D,F,H) for cells expressing the indicated shRNAs or plasmids. Data are presented as the mean ± SD from three independent experiments. * p < 0.05, ** < 0.01, *** < 0.001, ns, not significant.

