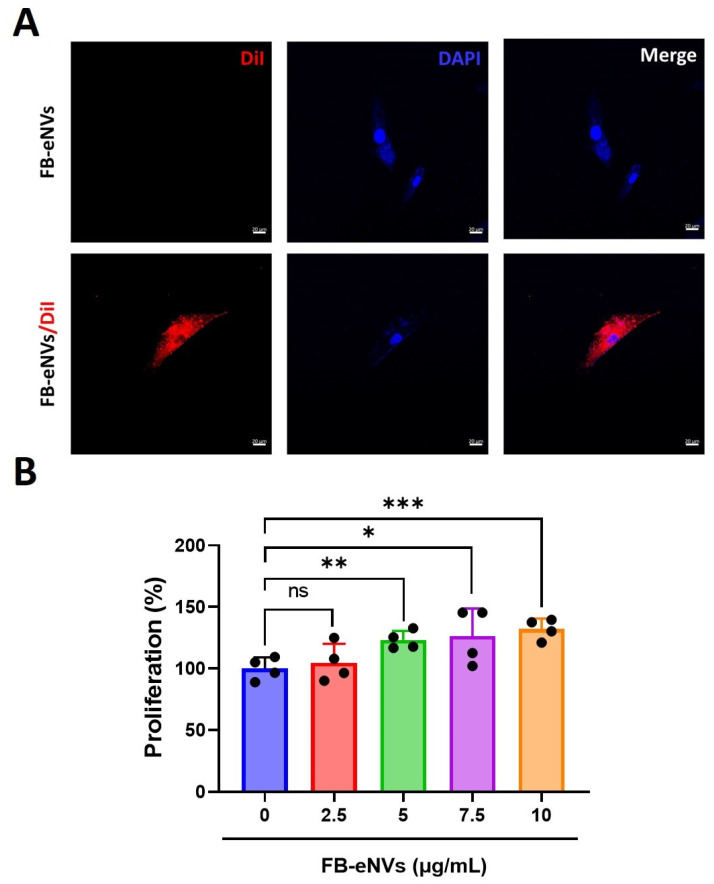
Figure 3.
Cellular uptake of FB-eNVs into DP cells and proliferation of DP cells by FB-eNVs. (A) In vitro uptake of fluorescent stain (DiI)-labeled FB-eNVs to DP cells at 3 h. No FB-eNVs were detected in the control samples. The cell nucleus was stained with DAPI. Scale bar, 20 µm. (B) Percentage of proliferation of DP cells (n = 4) at 24 h after treatment with FB-eNVs (0 to 10 µg/mL). The values are mean ± sd of a minimum of three replicates of an experiment. Student’s t-test was used. * p < 0.05; ** p < 0.01; and *** p < 0.001. ns: not significant.

