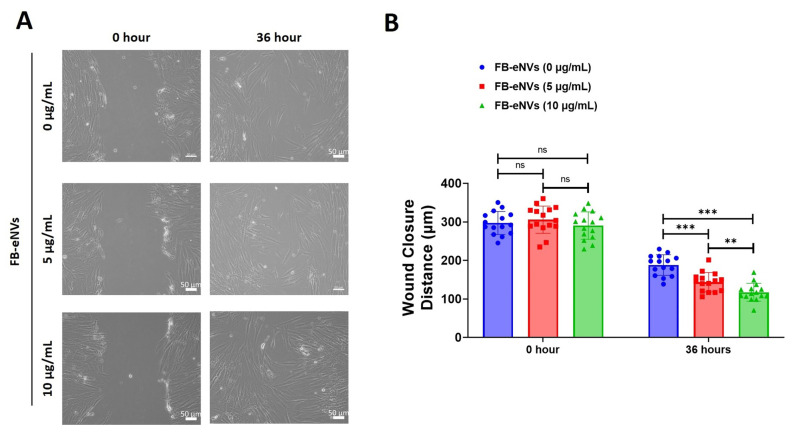
Figure 4.
FB-eNVs promoted the migration of DP cells. (A) Phase-contrast microscopy images of migrated cells at 0 and 36 h after FB-eNV (5 and 10 µg/mL) treatment. Scale bar: 50 µm. (B) Percentage of wound closure (n = 16) at 0 and 36 h after FB-eNV (5 and 10 µg/mL) treatment. The values are mean ± sd of a minimum of three replicates of an experiment. Student’s t-test was used. ** p < 0.01; and *** p < 0.001. ns: not significant.

