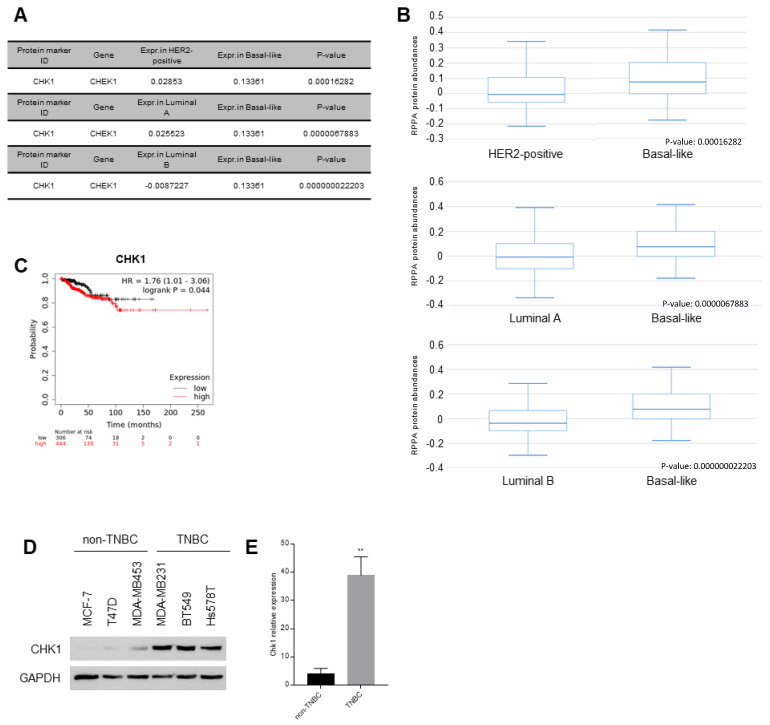
Figure 5.
The expression of CHK1 protein according to breast cancer subtypes. (A) CHK1 protein expression level with basal-like subtype of breast patients versus HER2-positive, luminal A, and luminal B from ‘The cancer proteome atlas’. (B) CHK1 protein expression comparison graph from ‘The cancer proteome atlas’. (C) The survival rate of breast cancer patients according to CHK1 protein expression using the KM plotter website. (D) Western blotting of CHK1 in non-TNBC cell lines, including MCF-7 and T47D, and TNBC cell lines, including MDA-MB453, MDA-MB231, BT549, and Hs578T. (E) The graph showing quantification of CHK1 expression normalized with endogenous GAPDH through Graphpad. Columns are presented with the mean of SEM. Statistical analysis using t-test was performed by comparing non-TNBC and TNBC; ** p < 0.005 vs. control in each group.

