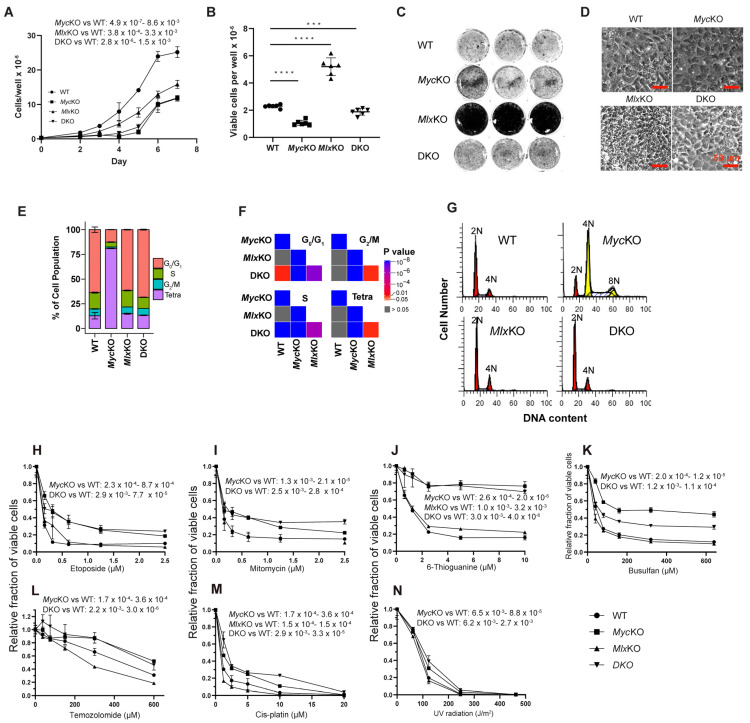
Figure 7.
Properties of SV40 T-antigen-immortalized MEFs: (A) Growth curves performed as described in Figure 1E–G. (B) Maximum saturation densities attained by the indicated immortalized MEF lines. Logarithmically growing cells were allowed to achieve a confluent state over 2–3 days and were then maintained for an additional 2 weeks, with standard medium changes (10% FBS) being performed twice weekly. Cell counts were performed on six replicates from each group. (C) The indicated cells were plated and maintained under confluent conditions for two weeks as described for (B) and then stained with crystal violet. Three replica wells are shown for each group (D). Phase-contrast micrographs of typical fields obtained just prior to crystal violet staining of the cells shown in (C). (E) Cell-cycle analyses performed and analyzed as described in Figure 2A,B. The results shown are the mean values obtained from six independent analyses performed in parallel for each cell line ± 1 S.E. (F) Comparison of cell-cycle populations among the four MEF groups, as described in Figure 2B. (G) Typical cell-cycle profiles of each MEF cell line showing the presence of tetraploidy/pseudo-tetraploidy in > 80% of MycKO cells. (H) Dose–response curves of the indicated cell lines maintained in the indicated concentrations of etoposide. Cells were plated at densities of 4–6 × 10⁴ cells/well, allowed to attach for 24 h, and then exposed to fresh medium containing the indicated concentrations of etoposide. Total viable cell counts were determined three days later. Each point represents the mean of three replicates ± 1 S.E. (I–M) Dose–response curves performed as described in (H) except with the indicated drugs. (N) Dose–response curves performed as described in (H) except that the cells were exposed to the indicated doses of UV light. *** p < 0.001, **** p < 0.0001.

