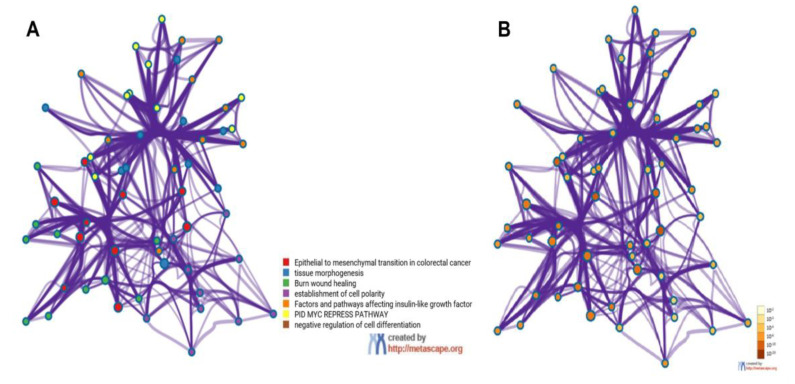
Figure 3.
Metascape cluster analysis across input gene lists (MMP3, ITGAV, KRT14, PLEK2, SNAI2, GSK3B, ITGB1, MAP1B, TCF3, VPSA13, SMAD2, MMP2, SPARC, WNT5A, and ITGA5), Network of enriched terms: (A) colored by cluster-ID, where nodes that share the same cluster-ID are typically close to each other; (B) colored by p-value, where terms containing more genes tend to have a more significant p-value.

