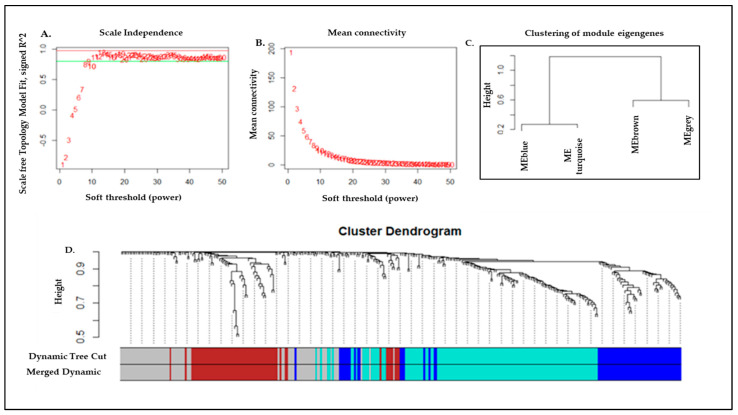
Figure 3.
WGCNA network and module detection. Selection of the soft-thresholding powers. (A) the scale-free fit index versus soft-thresholding power. (B) The second panel displayed the mean connectivity versus soft-thresholding power. Power 91 was chosen, for which the fit index curve flattens out upon reaching a high value (>0.7). (C) WGCNA-derived cluster dendrogram and module assignment. Genes were clustered based on a dissimilarity measure (1-TOM). The branches correspond to modules of highly interconnected groups of genes. Colors in the horizontal bar represent the modules. Four modules with 335 annotated transcripts were detected with WGCNA. (D) Meta-module identification and module-module relationship. The module network dendrogram was constructed by clustering module eigengene distances. The horizontal line (blue and red line) represents the threshold (0.2) used for defining the meta-modules. Thus, 4 distinct gene modules were identified.

