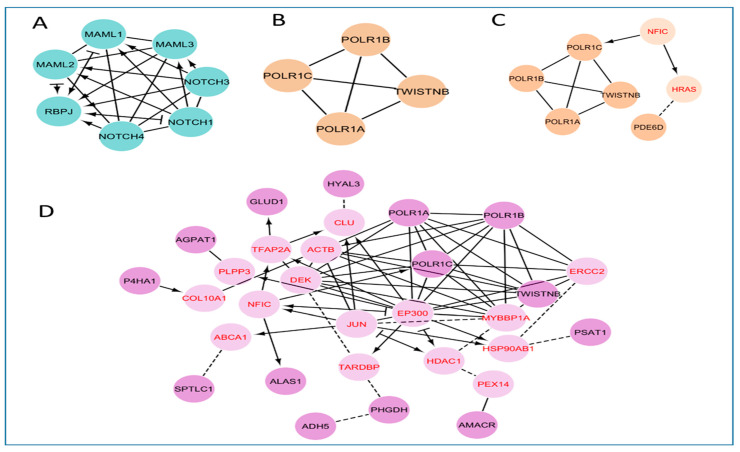
Figure 4.
Protein–protein network analysis. (A) Notch signaling pathway, (B) Pyrimidine pathway, (C) Purine pathway, and (D) Metabolic pathways. Network edges represent Reactome functional interactions: (–) represents protein complex; (→) represents activating; (–|) represents inhibiting; (—), predicted. Clusters were labelled with the transporter classes and/or activities represented by the majority of proteins within that cluster.

