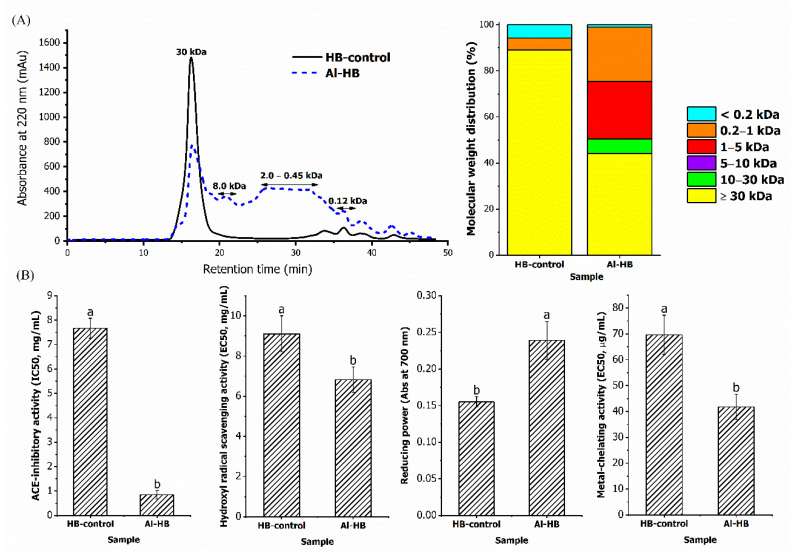
Figure 2.
(A) The molecular weight distribution of HB-control and Al-HB after passage through a Superdex Peptide 10/300 GL column. (B) The ACE-inhibitory and antioxidant activities of the HB-control and Al-HB. The values represent the mean ± SD. Means without a common letter (a, b) on the bars indicate significant difference at p < 0.05.

