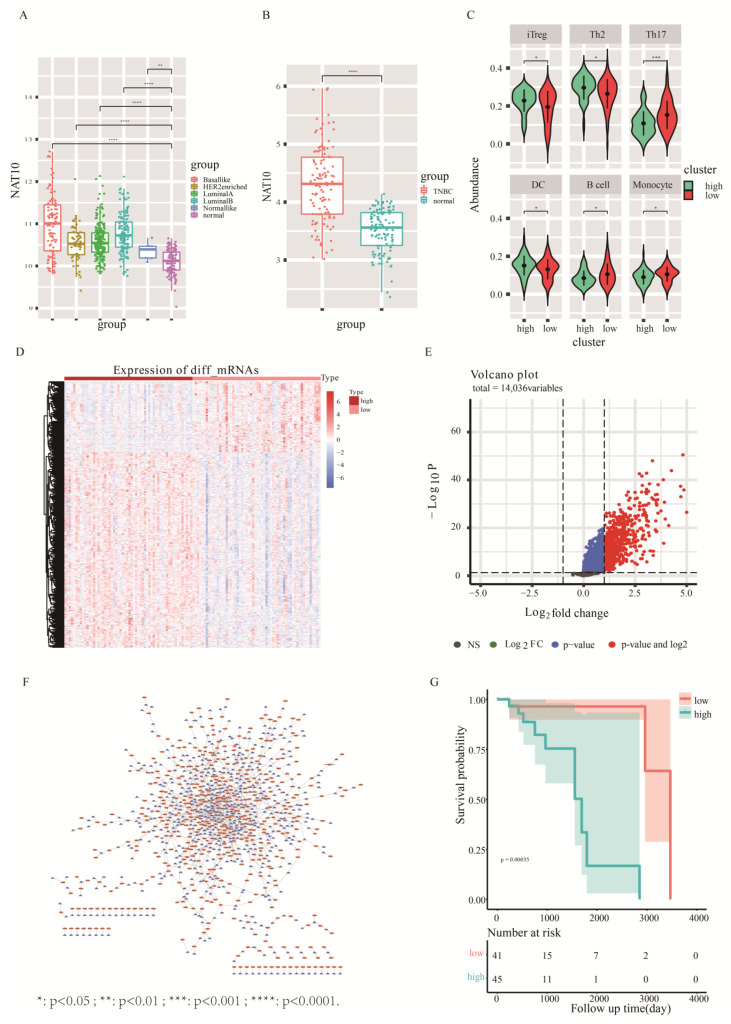
Figure 2.
Assessment of NAT10 characteristics in TNBC based on the TCGA database. (A) Expression levels of NAT10 in various molecular subtypes of TCGA breast cancer. (B) Expression levels of NAT10 in TNBC and paraneoplastic samples. (C) Differences in the abundance of immune cell infiltration in samples from high- and low-NAT10 expression groups. (D) Heatmap of differentially expressed genes (mRNA levels) between high- and low-NAT10 expression groups. (E) Volcano plot of the analysis of differentially expressed lncRNAs in high- and low-NAT10 expression groups. (F) Co-expression network of lncRNAs and mRNAs showing differences between NAT10 high- and low-groups. The blue triangle nodes are mRNAs, and the orange circle nodes are lncRNAs. (G):The survivel analysis between high-risk and low-risk group. *: p < 0.05 ; **: p < 0.01 ; ***: p < 0.001 ; ****: p < 0.0001.

