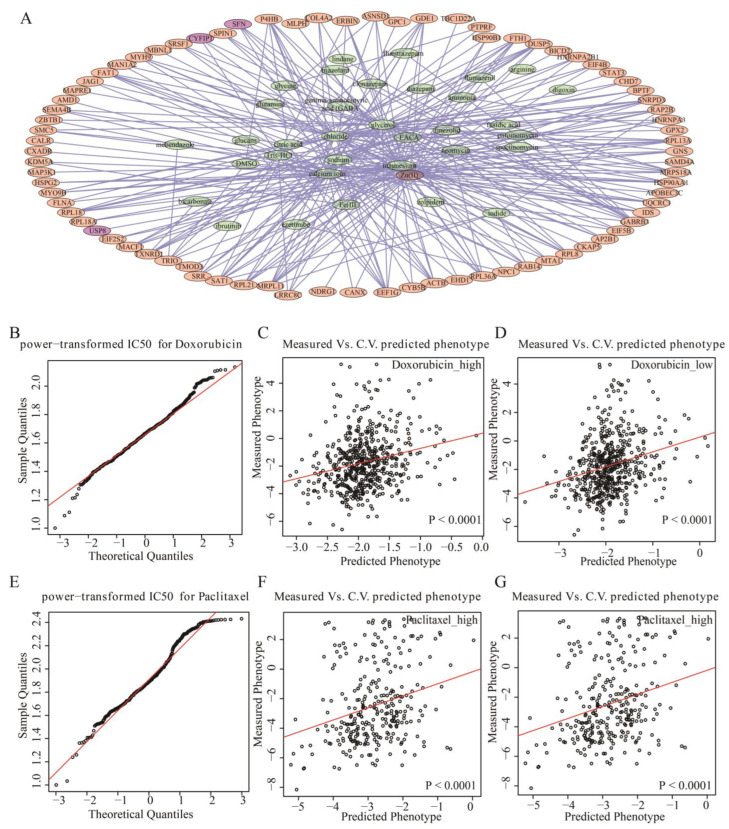
Figure 6.
Acetylated ac4C genes predict drug sensitivity. (A) Drug-target network of difference ac4C genes. The orange and purple nodes are differential ac4C genes, the green nodes are drug names, and the purple nodes are prognostic risk genes related to NAT10. (B) QQ plot of power-transformed IC50 values for doxorubicin. (C) Predicted IC50 of doxorubicin in the high-risk group. (D) Predicted IC50 of doxorubicin in the low-risk group. (E) QQ plot of power-transformed IC50 values for paclitaxel. (F) Predicted IC50 of paclitaxel in the high-risk group. (G) Predicted IC50 of paclitaxel in the low-risk group.

