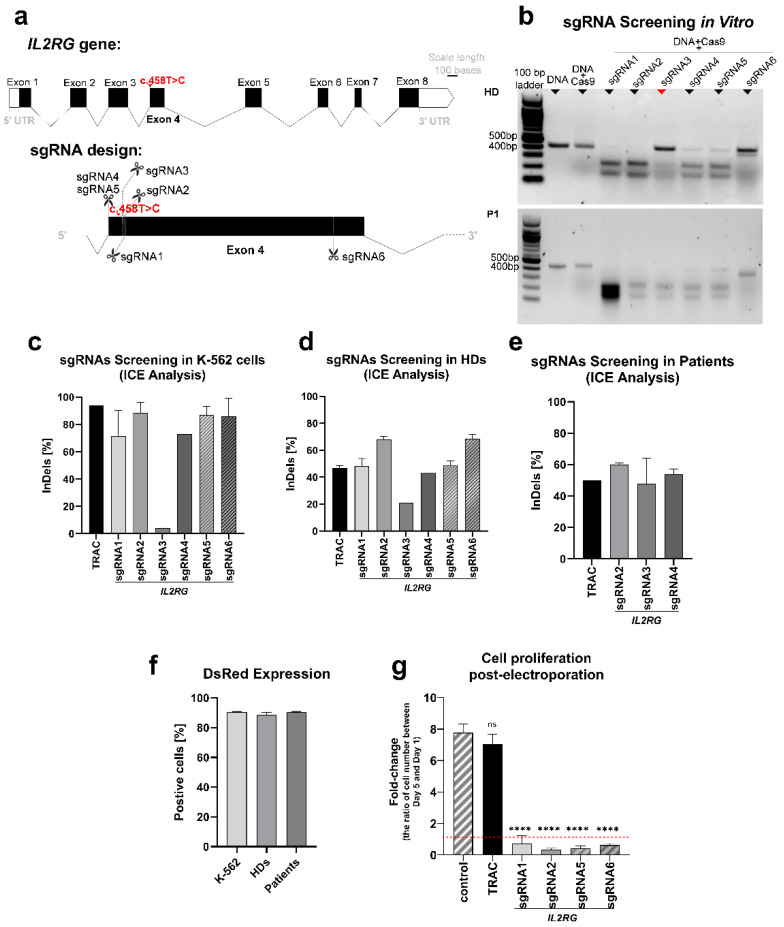
Figure 2.
Design and screening of sgRNAs. (a) Schematic representations of the IL2RG gene and designed sgRNAs were created in the Exon-Intron Graphic Maker (http://wormweb.org/exonintron) and modified in PowerPoint. the IL2RG gene’s eight exons are depicted: the c.458T>C mutation is presented on Exon4. The cutting sites of all designed sgRNAs are highlighted. sgRNA1 and 5 target the wild-type sequence; sgRNA3 and 4 target the mutant sequence; and sgRNA2 and 6 target both sequences. (b) In vitro CRISPR/Cas9 cutting assay. The visualization of the agarose gel showed that the PCR products (409 bp) were cut into fragments of different sizes after RNP incubation for 2 h (bands with 246 bp and 163 bp for sgRNA1; 251 bp and 158 bp for sgRNA2; 250 bp and 159 bp for sgRNA3; 243 bp and 166 bp for sgRNA4; 243 bp and 166 bp for sgRNA5; 364 bp and 45 bp for sgRNA6). sgRNA1, 2, 4, 5, and 6 similarly cut the target DNA amplicon of both the healthy donor (HD) and P1, while sgRNA3 only worked for the DNA of P1. (c) sgRNA screening of K–562 cells (n = 2). All sgRNAs led to a more than 70% indel frequency, except sgRNA3 (4%). (d) sgRNA screening of T cells in healthy donors (n = 3). sgRNA3 generated a 21% indel rate, whereas the rest of the sgRNAs generated a more than 60% indel rate. (e) sgRNA screening of T cells in patients (n = 2, P1 and P2). sgRNAs induced a 32–64% indel formation. (f) DsRed protein expression was detected 24 h post-transfection with flow cytometry as 90% in K–562 and T cells. (g) The proliferation rate of transfected T cells (healthy donors, n = 3) is calculated according to the fold-change (ratio) of the cell number between day 5 and day 1 post-electroporation. Compared with non-transfected cells, the proliferation rate was reduced significantly in cells transfected with IL2RG sgRNAs and Cas9 (****, p < 0.0001; ordinary one-way ANOVA test) but not in cells transfected with TRAC sgRNA and Cas9 (ns, p > 0.05; ordinary one-way ANOVA test). Mean ± SEM of biologically independent experiments is shown.

