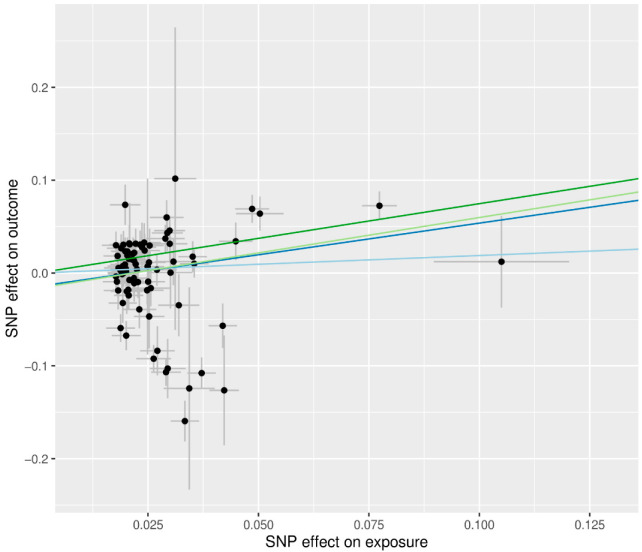
Figure 3.
Scatter plots of MR tests assessing the effect of BMI on T2D. The dots represent the effect size (β) of each SNP on BMI (x-axis) and T2D (y-axis), and the grey lines show their standard errors. Regression slopes show the estimated causal effect of BMI on T2D. The light blue, dark blue, light green, and dark green regression lines represent the IVW, MR-Egger, MR-Egger (SIMEX), and weighted median estimate, respectively. MR: Mendelian randomization; BMI: body mass index; T2D: type 2 diabetes; SNP: single nucleotide polymorphism; IVW: inverse-variance weight; SIMEX: simulation extrapolation.

