
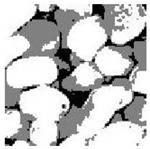
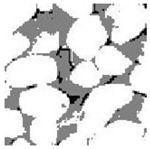
Table 1.
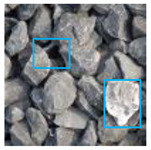
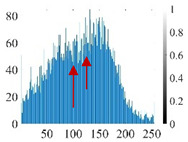
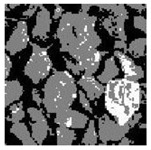
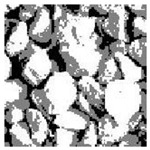
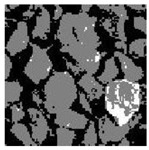
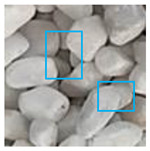
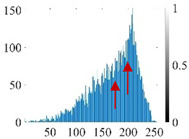
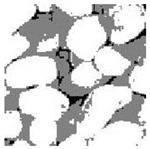
The segmentation results of aggregate images by three METs. The blue box is the area where the segmentation results are significantly different, and the red arrow is the extreme value in the histogram.
| Original Image | Histogram | Renyi Entropy | Symmetric Cross Entropy |
Kapur Entropy |
|---|---|---|---|---|
|
|
|
|
|
|
|
|
|
|