Table 6.
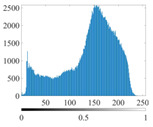
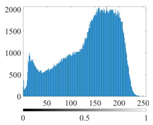
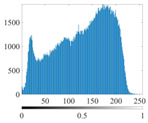
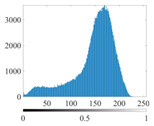
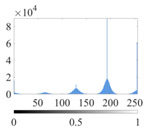
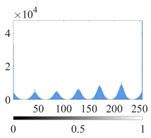
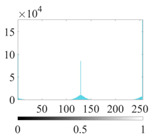
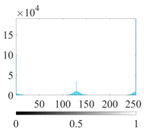
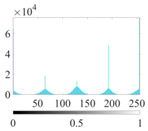
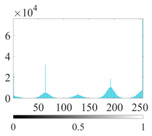
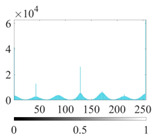
Histograms of the aggregate image segmentation results.
| No. 1 | No. 2 | No. 3 | No. 4 | No. 5 | |
|---|---|---|---|---|---|
| Original image |
|
|
|
|
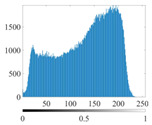
|
| K | 2 | 2 | 4 | 4 | 6 |
| PERSSA-Renyi Entropy |
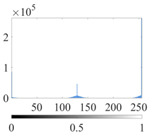
|
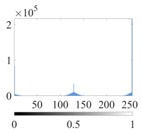
|
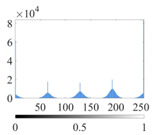
|
|
|
| FCM |
|
|
|
|
|
Histograms of the aggregate image segmentation results.
| No. 1 | No. 2 | No. 3 | No. 4 | No. 5 | |
|---|---|---|---|---|---|
| Original image |

|

|

|

|

|
| K | 2 | 2 | 4 | 4 | 6 |
| PERSSA-Renyi Entropy |

|

|

|

|

|
| FCM |

|

|

|

|

|