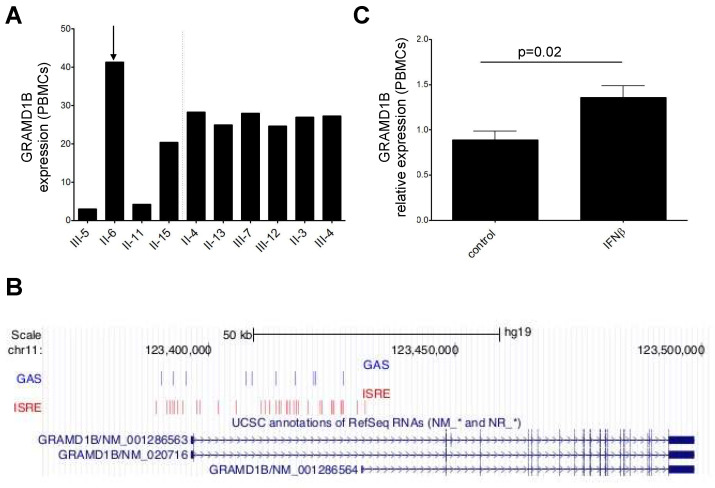
Figure 4.
GRAMD1B mRNA expression in whole blood of members of the MS multiplex family, and in PBMC isolated from HC. (A) Relative GRAMD1B mRNA expression in whole blood from affected (on the left of the dashed line) and unaffected relatives (on the right of the dashed line) of the original MS multiplex family measured with Illumina arrays. The arrow indicates the unique MS patient who was IFNβ-treated. (B) ISRE and GAS elements in the GRAMD1B promoter and first intron identified in the in silico analysis are shown in the “GAS” and “ISRE” tracks, while the position of the gene is indicated in the “UCSC annotation of RefSeq RNAs” track; genomic position is indicated at the top. (C) Relative GRAMD1B mRNA expression in PBMC isolated from HC before and after stimulation with IFNβ immunomodulatory cytokine measured by qRT-PCR (n = 5). p-value refers to the comparison of expression values at baseline and after stimulation. Standard deviations are reported as bars. Error bars represent SEM.

